The bar charts below show the percentages of men and women in employment in three countries in 2005 and 2015.

The bar charts below show the percentages of men and women in employment in three countries in 2005 and 2015.
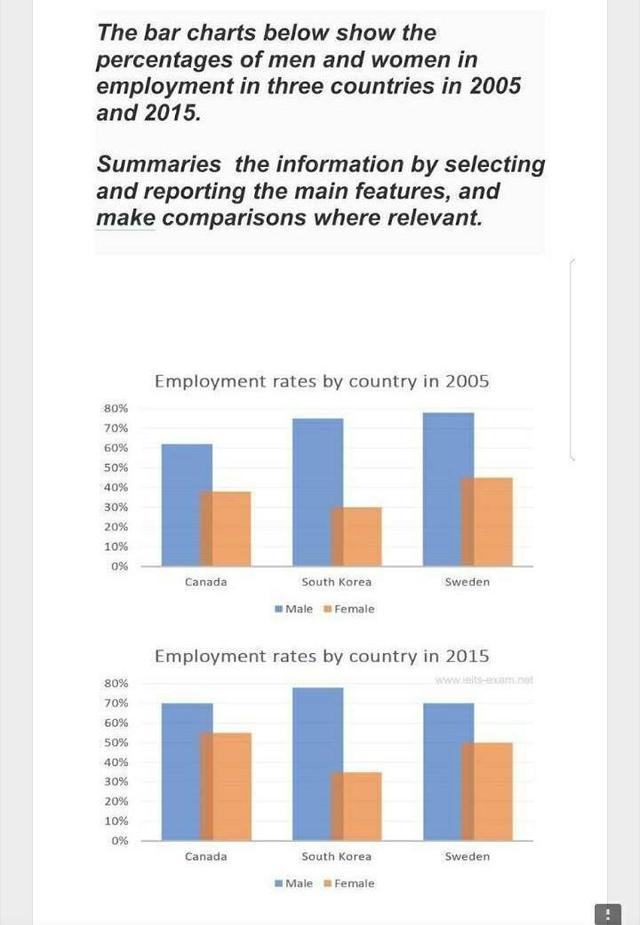
The graphs depict the proportion of both genders in employment in countries
such
as Canada,South Korea and Sweden in two time periods.
Overall
, it can be clearly seen that there is a predominance of men in the workplace and there is a noticeable growth in almost every nation in both years. Canada showed the biggest incline throughout the years. The male percentage in 2005 was just over 60% and it rose significantly to 70% in 2015.
While
female rates were at slightly under 40% and rocketed to over 50% respectively, from year 2005 to 2015. South Korea and Sweden demonstrated approximately 70% and just under 80% in the men's chart in 2005, which increased to just around 80% in South Korea and fell to 70% in Sweden in 2015. Female rates in both countries changed marginally, showing an increase from 30% and nearly over 45% in 2005, to under 40% and 50% in 2015 respectively.
Submitted by zhadyra.serikbayeva2016 on

Unauthorized use and/or duplication of this material without express and written permission from this site’s author and/or owner is strictly prohibited. Excerpts and links may be used, provided that full and clear credit is given to Writing9 with appropriate and specific direction to the original content.

Sentences: Add more complex sentences.
Vocabulary: The word "increased" was used 2 times.
Topic Vocabulary:
  • bar charts
  • percentages
  • employment
  • countries
  • 2005
  • 2015
  • trends
  • differences
  • changes
  • men
  • women
  • variations
  • patterns
  • significant
  • observations
  • summarize
  • findings
  • predictions
  • future trends
What to do next:
Look at other essays: