The bar chart below shows the percentage of Australian men and women in different age of groups who did regular physical activity in 2010.

The bar chart below shows the percentage of Australian men and women in different age of groups who did regular physical activity in 2010.
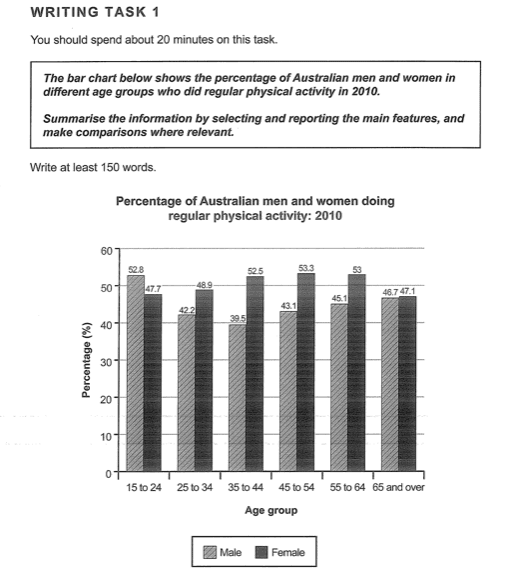
The provided bar chart presents the outlook of men and women in Australia from varied
age
Fix the agreement mistake
ages
show examples
of people who actively did physical movement in 2010.
Overall
, the Australian male showed a downward trend
while
female rates
depict
Verb problem
apply
show examples
fluctuate
Wrong verb form
fluctuated
show examples
in the period given. Looking at the information in more detail, the proportion of women who did physical activity was noticeably higher at the
age
of 45 to 54, more than 53%. The percentage slightly
decrease
Change the verb form
decreases
show examples
when women turn above 50 years old, at 53%. The lowest rates were revealed by the
age
of 65 and above, at more than 47%.
On the other hand
, the percentage of
man
Fix the agreement mistake
men
show examples
who did physical activities was noticeably higher at the
age
of 15 to 24 years old, the number significantly
fall
Wrong verb form
falling
show examples
by 10% from 52.8% to 42.2%. The trend remained exsiccate until there is gradually
increasing
Wrong verb form
increased
show examples
at the
age
of 45 to 54, about 43.1%.
Submitted by semangatbanget.s2 on

Unauthorized use and/or duplication of this material without express and written permission from this site’s author and/or owner is strictly prohibited. Excerpts and links may be used, provided that full and clear credit is given to Writing9 with appropriate and specific direction to the original content.

Vocabulary: Replace the words age with synonyms.
Vocabulary: The word "percentage" was used 2 times.
Vocabulary: The word "trend" was used 2 times.
Topic Vocabulary:
  • Physical activity
  • Regular exercise
  • Age demographics
  • Participation rate
  • Trend analysis
  • Gender disparity
  • Health initiatives
  • Public health policies
  • Statistical comparison
  • Lifestyle choices
  • Work commitments
  • Age-related factors
  • Preventative health
  • Exercise habits
  • Surveillance data
  • Motivators and barriers
What to do next:
Look at other essays: