
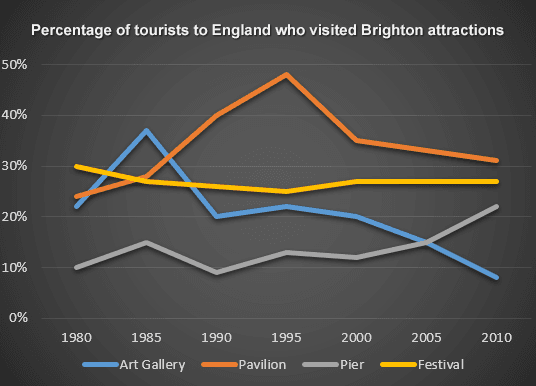
The graph illustrates the
number
of tourists who visited four different attractions in England, specifically in Brighton, during the time Use synonyms
period
from 1980 to 2010. The measurements are given in percentages.
Use synonyms
Overall
, the Linking Words
number
of tourists who visited the pier and pavilion increased from 1980 to 2010. Use synonyms
However
, the Linking Words
number
of Use synonyms
visitors
to the art gallery in Brighton decreased, Use synonyms
while
the Linking Words
number
of Use synonyms
visitors
to the festival remained relatively unchanged by the end of the Use synonyms
period
.
The percentage of tourists who visited the pier in Brighton fluctuated from the beginning of the Use synonyms
period
to 2000, and Use synonyms
then
it started to gradually increase, reaching approximately 21%. In terms of Linking Words
visitors
to the pavilion, the graph shows a significant increase from the start of the Use synonyms
period
to 1995 when it reached its highest point at 48% of Use synonyms
visitors
. Use synonyms
Afterward
, it began to decline, reaching 31% by 2010.
Regarding Change the spelling
Afterwards
visitors
to the art gallery, the graph demonstrates an increase followed by a subsequent decrease from 1980 to 1990. After 1990, the percentage of Use synonyms
visitors
remained relatively unchanged and Use synonyms
then
gradually decreased.
The Linking Words
number
of Use synonyms
visitors
to the festival varied between 26% and 30% but did not exceed 30% from 1980 to 2010.Use synonyms