
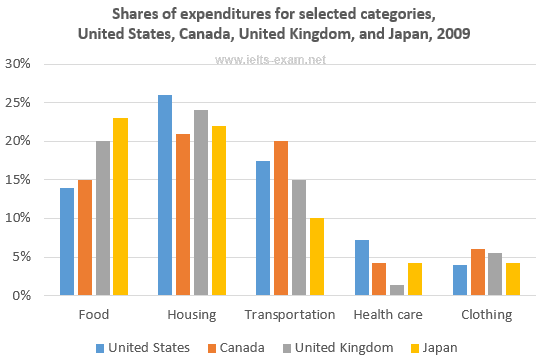
Contained in the bar chart is information pertaining to the money spent on five main categories in four distinct
countries
during 2009.
Use synonyms
Overall
, it is evident that housing expenditure in most Linking Words
countries
was much higher than in the other categories, with the exception of Japan where people spent more on food. Use synonyms
Additionally
, the spending on healthcare and clothing was the lowest throughout the surveyed time.
In 2009, Americans spent the most on housing approximately 26%. Linking Words
Similarly
, the other 3 Linking Words
countries
ranged between 21% and 23%. Regarding food, Japan outweighed the others at around 24%, whilst the United Kingdom, Canada and the USA accounted for 20%, exactly 15% and 14% respectively. As for transportation, the highest expense was in Canada at 20%, followed by the United States at 18%. Below Use synonyms
this
level of money spent on transport was the United Kingdom (15%) and Japan (10%).
Turning to the remaining statistics, it is evident that all nations spent less on health care and clothing. With respect to health care, the United States’s expense stood at roughly 8%, Linking Words
whereas
the United Kingdom made up 2%, making it the biggest difference. Linking Words
However
, Canadians’s spending and Japan’s was the same, around 4%. In terms of clothing, the highest data was seen in Canada at nearly 7%, Linking Words
while
the figure for the other 3 Linking Words
countries
ranged from 4% to 6%.Use synonyms