
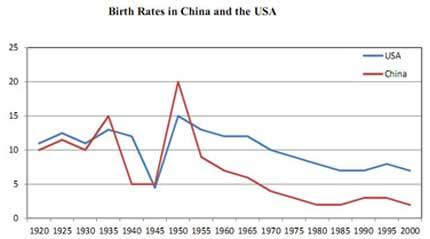
The line chart displays the Natality in
USA
and China between 1920 and 2000.Correct article usage
the USA
Overall
, it is evident that there was a downward trend in the Linking Words
numbers
of Fix the agreement mistake
number
birth
in the two countries over the years.
Fix the agreement mistake
births
To begin
with, In 1920,the highest value stood at 11 in the United Linking Words
states
and 10 in China.The two countries Capitalize word
States
both
witnessed a similar pattern from 1920 to 1930 as there Use synonyms
was
fluctuations, Change the verb form
were
although
, between 1930 and 1935, there was an intersection of Linking Words
both
rates at 12 followed by a plunge in Use synonyms
both
nations to 5 in 1945.
Use synonyms
Furthermore
, there was a rapid increase to 20 in America hitting the peak of the chart, simultaneously,the other country Linking Words
also
saw a sudden rise to 15 in 1990.Linking Words
However
, there was a dramatic fall in Linking Words
both
figures in Use synonyms
both
countries as Use synonyms
USA
stood at 7 being the highest birth value in that year,Correct article usage
the USA
while
China dipped to 3 and was the Linking Words
least
in 2000.Correct word choice
lowest