
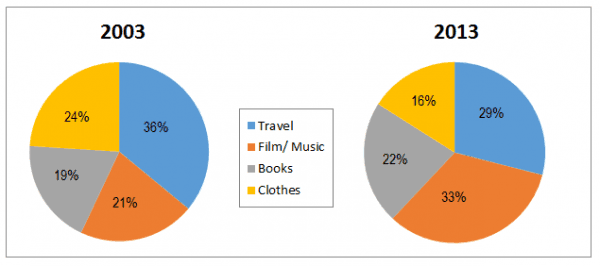
The proffered two pie charts provide information about the proportion of online shopping sales in four major retail sectors namely travel, films / music, books, and clothes between 2003 and 2013.
Broadly, it is readily apparent that the travel
sector
contributed the biggest percentage in the first period Use synonyms
while
the film / music Linking Words
sector
dominated the highest fraction in the second period.
Looking at the chart, the dominant position came from travel agents, making up just over a third per cent in 2003. Use synonyms
Furthermore
, it became the second rank in 2013 with 29%. Linking Words
In contrast
, the biggest proportion in 2013 went to the clothes Linking Words
sector
which comprised 33%. Use synonyms
However
, nearly a quarter per cent contributed by Linking Words
this
Linking Words
sector
in 2003.
In terms of books retail Use synonyms
sector
, the proportion in 2013 was bigger than in 2003, both recorded at 19% and 22% respectively. The lowest fraction was shown by clothes which made up 16% in 2013 and the books Use synonyms
sector
with almost a fifth per cent.Use synonyms