
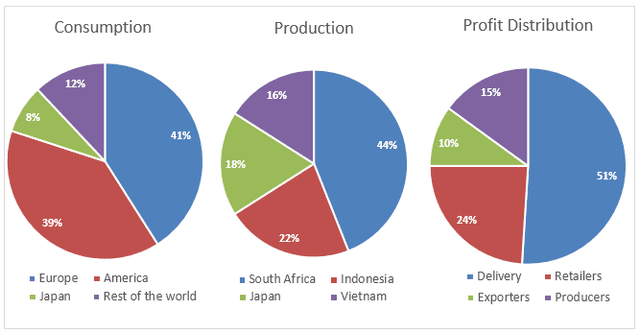
The three pie charts illustrate, the proportion of global production, intake and revenue share of the coffee beans market.
Overall
, Linking Words
it is clear that
the top producers of Linking Words
this
bean are not the biggest consumers; Linking Words
however
, the western countries are the most significant buyers of Linking Words
this
product. Linking Words
Moreover
, the benefit earned in Linking Words
this
industry mostly goes to the supply chain actors rather than the producers.
In terms of its production, almost two-thirds of its portion is produced by South Africa (44%) and Indonesia (22%). Linking Words
Nevertheless
, Japan and Vietnam produce an almost equal amount of coffee, which is 18% and 16% respectively.
Linking Words
Conversely
, Europe and America are the biggest consumers sharing 80% of its consumption. Linking Words
However
, Japan consumes 8% of the share, Linking Words
while
producing 18%.
Linking Words
On the other hand
, the maximum profit margin goes for delivery purposes, Linking Words
whereas
the producers gain only 15% of the total pie. Thereby, the rest proportion of the profit is availed by the retailers and exporters amounting to 24% and 10%.Linking Words