
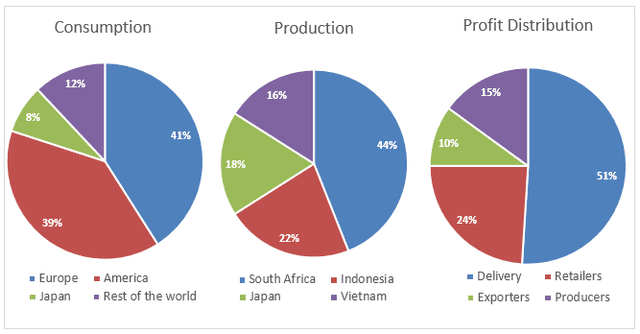
The pie charts give information about coffee in terms of consumers worldwide, manufacturing in four countries, and profits given to four parties in the caffeine industry.
Overall
, what stands out from the graph is that Europeans and Americans prefer drinking coffee over the remaining continents and South Africa is the world’s largest caffeine producer. Another notable point is that delivery companies account for more than half of the total profit.
Looking into consumption, utilization in Europe and America accounts for the highest proportion, with 41% and 39%, almost three times as high as the percentage of the rest of the world, at only 12%. Meanwhile, Linking Words
this
figure for Japan is the lowest, at 8% of the total.
Regarding producing coffee, Indonesia makes only half as much in relative terms of manufacturing (22%) as South Africa (44%), the top producer in the provided chart. The other two countries are Japan and Vietnam, making nearly the same quantity, with 18% and 16% respectively.
The Linking Words
last
figure is the profit distribution, delivery companies account for more than half of the profits made by the sales of caffeine, at 51%. Linking Words
In contrast
, retailers only receive 24% of the total money, but still higher than that of producers and exporters, representing 15% and 10% of the total respectively.Linking Words