
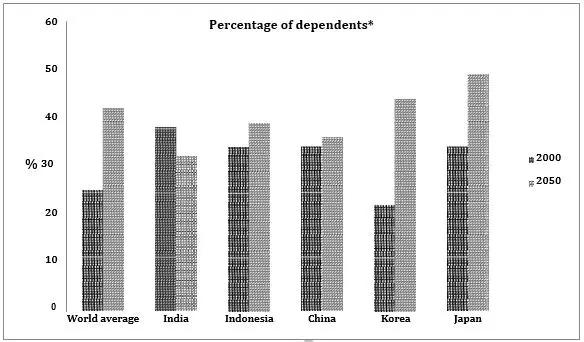
The bar graph
depics
the proportion of Correct your spelling
depicts
depict
dependents
in five Use synonyms
countries
Use synonyms
along with
Linking Words
world
average in 2000 and a prediction for 2050.
Correct article usage
the world
Overall
, percentages of Linking Words
dependents
in given Use synonyms
countries
except for Korea were higher than the world average in 2000. Interestingly, the rates of Use synonyms
dependents
in India, Indonesia and China will be estimated to decrease lower than the world average in 2050.
Use synonyms
According to
the graph, the rate of Linking Words
dependents
is predicted to rise from nearly 40% to around 30%, between 2000 and 2050.
Turning to the remaining Use synonyms
countries
, an increase is estimated for all of them in the Use synonyms
dependents
rate. The most remarkable rise is expected in Korea, which more than double Use synonyms
rising
in fifty years. The second significant increase is predicted in Japan, from just above 30 per cent to 50 per cent in the whole time frame. Despite Verb problem
apply
in
Indonesia and China Change preposition
apply
are
estimated to follow an increasing trend , meanwhile, Wrong verb form
being
these
rate Correct determiner usage
this
rising
may be considered as Replace the word
rise
a
slight compared to other Correct article usage
apply
countries
( Korea Use synonyms
ang
Japan).Correct your spelling
and