
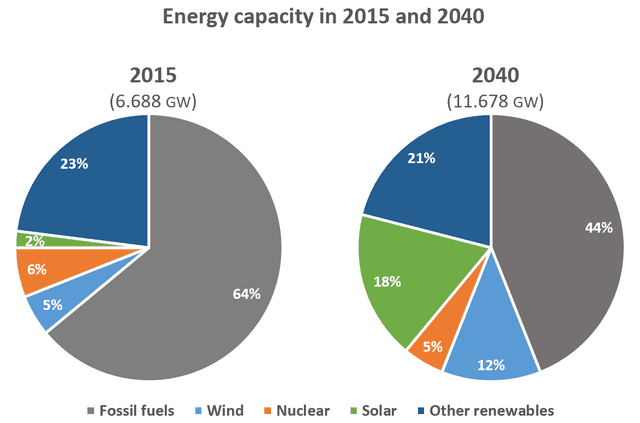
These pie charts show how the rates of
energy
capacity in gigawatts (Use synonyms
GW
) change in 2015 and 2040. It Use synonyms
clear
from the graph that the Add a missing verb
is clear
energy
capacity increased Use synonyms
about
5 Change preposition
by about
GW
from 6.688GW to 11.678GW in 2015 and 2040.
Use synonyms
According to
what is shown, fossil fuels was Linking Words
highest
ratio in both Change the article
the highest
Linking Words
this
two years with Change the determiner
these
a
64 Correct article usage
apply
percentage
in 2015 and it decreased to 44% in 2040. Use synonyms
Also
, the other renewable Linking Words
energy
was Use synonyms
fall
Wrong verb form
fell
almost
2% from 2015 until 2024.
Change preposition
by almost
While
Linking Words
the
solar Correct article usage
apply
energy
was Use synonyms
lowest
Change the article
the lowest
energy
in 2015 it Use synonyms
jump
from 2 Wrong verb form
jumped
Use synonyms
percentage
to 18 Replace the word
per cent
Use synonyms
percentage
in 2040. Replace the word
per cent
Moreover
, Linking Words
the
wind Correct article usage
apply
energy
go up sharply from 5% in 2015 to 12% in 2024. Use synonyms
However
, almost 1% was Linking Words
drop
from Wrong verb form
dropped
Linking Words
this
two Correct determiner usage
these
year
in nuclear Fix the agreement mistake
years
energy
, with a 6 Use synonyms
percentage
in 2015 to 5 Use synonyms
percentage
in 2040.
Use synonyms
To sum up
, we could say that Linking Words
the
fossil fuels followed by other Correct article usage
apply
renewable
were the highest in Correct your spelling
renewables
this
period.Linking Words