
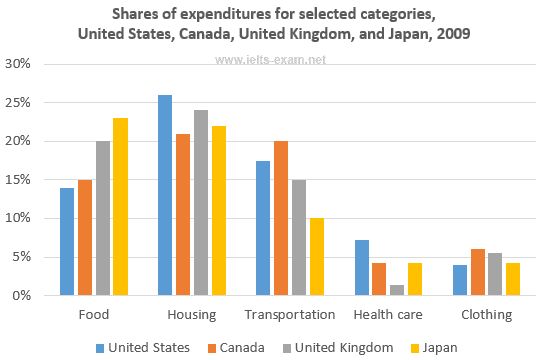
The vertical chart makes a comparison between the expenditures for five majors in 4 different nations in 2009.
Overall
, the highest expenditure was housing, Linking Words
meanwhile
the opposite was true for health care and clothing.
In detail, the proportion of Americans Add a comma
meanwhile,
spent
their Correct pronoun usage
who spent
time
on food, transportation and health care was 12%, 17%, and 7% respectively, Use synonyms
while
the figure for housing was 25%, which is 5 times as much as expenditure on clothing. Meanwhile, there was a similar percentage of Linking Words
time
allocated for housing and transportation by Canadians at 20%, followed by the Use synonyms
time
allocated for food, clothing and healthcare at 15%, 5% and over 5% respectively.
Use synonyms
On the other hand
, the United Kingdom and Japan experienced a minor difference in Linking Words
percentage
of 5 categories, with the largest gap being seen in transportation at 10%. Add an article
the percentage
Besides
that, the share of expenditure on Food and health care witnessed Japan’s citizens allocated 23% and 4% of their Linking Words
time
respectively, which is 2% higher than that in the United Kingdom.Use synonyms