
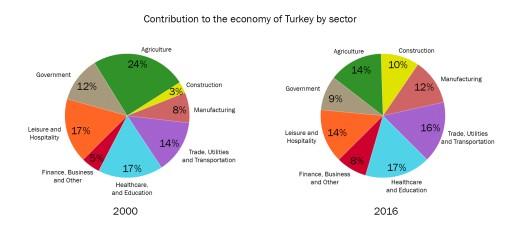
The two pie charts illustrate the different industrial sectors that contributed to the recession of Turkey percentage-wise in the years 2000 and 2016.
Overall
, at the beginning of the period construction contributed the least to the wealth of Turkey and agriculture was the most significant economic sector. In comparison, Linking Words
at the end
of Linking Words
theperiod
healthcare and education became the largest economic segment and the lowest contribution was made by financial, business and other services.
Correct your spelling
the period
To begin
with, the construction sector accounted for 3% of Turkey's economy in 2000 and experienced a more than threefold increase to one-tenth in 2016. Economic income from trade, utilities and transportation was 14% in 2000 and witnessed a slight growth of 2% in 2016. In the year 2000, manufacturing and finance, business and other services made up 8% and 5% of the economy, respectively, and they rose to 12% and 8% in 2016.
Linking Words
Further
analyzing the scheme, it can be noticed that agriculture, which comprised almost a quarter of its financial rate in 2000, fell to 14% in 2016. In 2000 economic outputs from the government and leisure and hospitality sectors were at 12% and 17%, respectively, and both decreased by 3% after a 16-year duration. Linking Words
In contrast
, contributions from the healthcare and education sectors remained constant in both years at 17%.Linking Words