
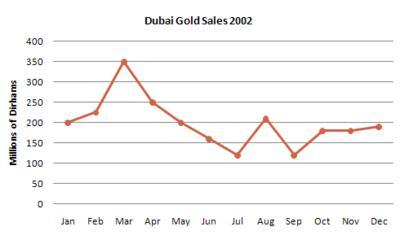
The graph illustrates the amount of
gold
sales in Dubai during the Use synonyms
year
.
Use synonyms
Overall
, it could be seen that the peak of Linking Words
gold
trading was in Use synonyms
March
.
To begin with, at the start of the Use synonyms
year
sales were approximately 200 Use synonyms
million
Use synonyms
Dirhams
and Use synonyms
then
, within 2 months, the numbers reached the prime degree of realisation and raised roughly 150 Linking Words
million
cash.To put it in more precise terms, for every month, there were 200 Use synonyms
million
Use synonyms
Dirhams
from Use synonyms
gold
in January; 225 Use synonyms
million
Use synonyms
Dirhams
from Use synonyms
gold
in February; and 350 Use synonyms
million
Use synonyms
Dirhams
from Use synonyms
gold
in Use synonyms
March
.
Interestingly, after aggressive growth until Use synonyms
March
, the sales met an unavoidable drop of approximately 225 Use synonyms
million
Use synonyms
dirhams
between Use synonyms
March
and July.Use synonyms
However
, after the month of August, the number is back to over 200 Linking Words
million
again, like at the start of the Use synonyms
year
.It Use synonyms
then
fluctuated over the Linking Words
last
4 months of the Linking Words
year
and ended the period slightly lower than where it began, at roughly 5 Use synonyms
million
Use synonyms
dirhams
.Use synonyms