
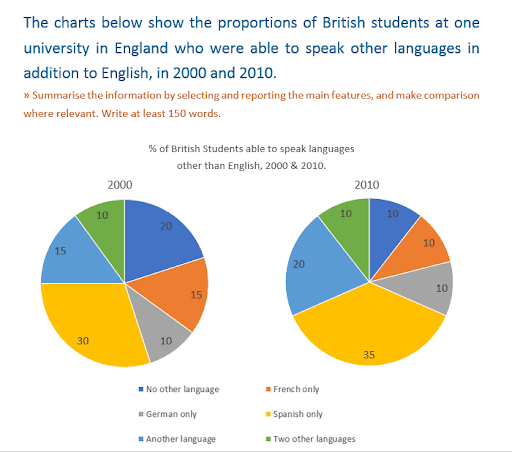
The pie charts compare the ratio of UK students who had the ability to speak in other languages with English in 2000 and a decade later.
Overall
, Linking Words
it is clear that
there was a fractional increase in the rate of another language and Spanish Linking Words
while
both categories French and without an extra language experienced a downward trend in the next period. Linking Words
Moreover
, it is Linking Words
also
worth noting that learning German and two other languages stood steady.
Linking Words
Initially
, focusing on the share of scholars who spoke Spanish represented almost one-third of the diagram and it was by far the most common extra language in the given interval. Linguistic proficiency in another expression was 15% in 2010, Linking Words
whereas
in the next 10-year period it rose by 5%.
Linking Words
Conversely
, British students with bilingualism French had an amount of 15% at the starting period before decreasing to 10% after a decade. Linking Words
Besides
that, the rate of scholars who gained only English tongue totalled 20% in 2000 and 10% in 2010 respectively. Linking Words
Last
but not least, the proportion of knowing German and other languages was at 10% at the beginning of the 21st century and in 2010 their figure remained stable at an identical degree.Linking Words