The given line graph illustrates the average data of a museum tourists in both summer and winter in the year 2003. Overall, it is observed that during summer, the museum had many visitors compared to winter. To begin with, the highest visits recorded were of about 1600 people to the museum at 12noon during the hot weather which declined to 800 people at 4pm. Whereas in winter about 500 visitors came at 10am which somewhat fluctuate till 12 noon. However, there was massive declined during the winter at 12noon till around 2pm whereas there was no visitors recorded from 2pm till 6pm unlike during summer, the downward trend was only from 4pm and there was no record of no visitors.

The given line graph illustrates the average data of a museum tourists in both summer and winter in the year 2003.

Overall, it is observed that during summer, the museum had many visitors compared to winter.

To begin with, the highest visits recorded were of about 1600 people to the museum at 12noon during the hot weather which declined to 800 people at 4pm. Whereas in winter about 500 visitors came at 10am  which somewhat fluctuate till 12 noon.

However, there was massive declined during the winter at 12noon till around 2pm whereas there was no visitors recorded from 2pm till 6pm unlike during summer,  the downward trend was only from 4pm and there was no record of no visitors.
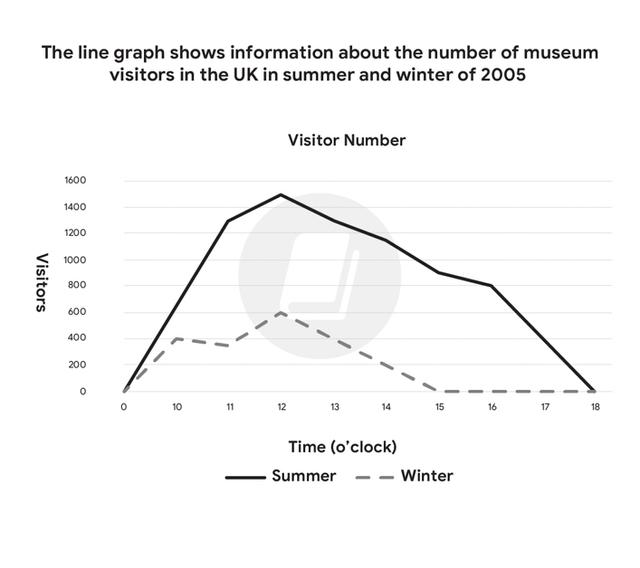
The line graph illustrates the mean
number
of tourists who entered a UK museum during the summer and winter seasons in 2003 within a time period.
Overall
, it is evident that a larger
number
of people trooped into the museum during the summer period than in winter. During both seasons, in the early hours, there was a rise in figures of the
number
of individuals that entered the museum
however
, their
number
declined towards the end of the time.
To begin
with, In summer, the influx of people increased steadily up to around 1300 by 1100 and
further
rose by approximately 400 people to its peak point of around 1500 before declining to 1800.
While
, in winter, there is an increase to 500 visitors in 1000 after which, a steady fluctuation was experienced up to 1200 before the values declined sharply to 0 at 1500. the figure remained relatively stable from 1500 to 1800.
Submitted by okoriej2 on

Unauthorized use and/or duplication of this material without express and written permission from this site’s author and/or owner is strictly prohibited. Excerpts and links may be used, provided that full and clear credit is given to Writing9 with appropriate and specific direction to the original content.

Vocabulary: Replace the words number with synonyms.
Vocabulary: The word "figures" was used 2 times.
Vocabulary: The word "number of" was used 3 times.
Vocabulary: The word "declined" was used 2 times.
Vocabulary: The word "increased" was used 2 times.
Vocabulary: The word "around" was used 2 times.
What to do next:
Look at other essays: