
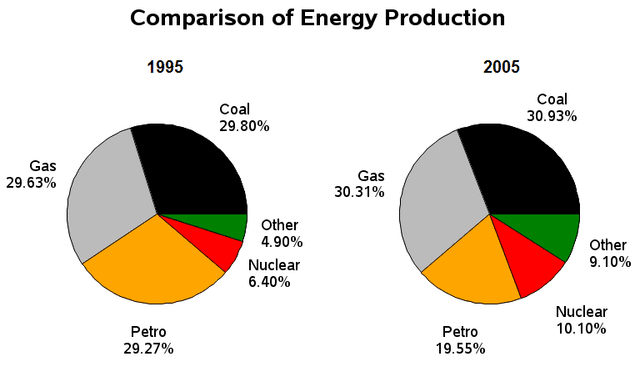
The charts illustrate how much
energy
was produced in 1995 and 2005 in France.
Use synonyms
Overall
, coal Linking Words
production
was the highest not only in the year 1995 but Use synonyms
also
in 2005, Linking Words
whereas
gas was the second most Linking Words
energy
Use synonyms
production
. Use synonyms
On the other hand
, the category labelled 'other' Linking Words
was
the lowest Verb problem
had
energy
in terms of productivity.
In 1995, coal accounted for the largest amount of Use synonyms
energy
Use synonyms
production
at 29.80%, Use synonyms
while
gas was lower at 29.63% and was as equal as petrol at 29.27%. Nuclear power Linking Words
production
Use synonyms
also
stood at just over 6% and other Linking Words
energy
Use synonyms
production
was the lowest at nearly 5%.
In 2005, the Use synonyms
production
of coal and gas increased minimally by 0.68 and 1.13, respectively. Use synonyms
In addition
, the proportion of petrol Linking Words
production
saw a gradual decline from 29.27 to 19.55. It is worth noting that, there was a dramatic growth of approximately 4% in the figure for both nuclear power and the category labelled 'other'.Use synonyms