
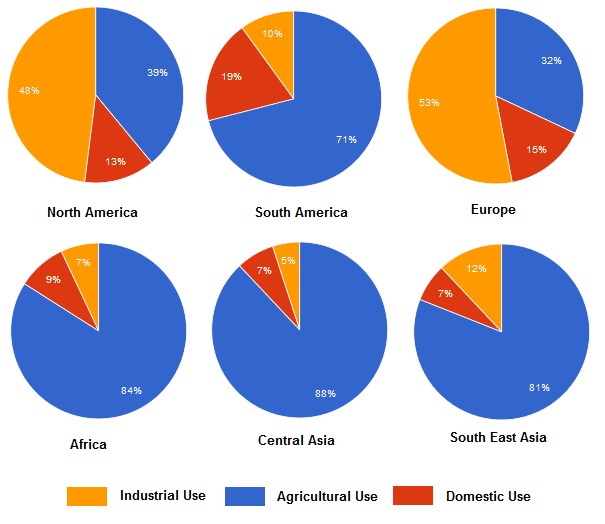
The pie chart represents information about the proportion of people in six places around the world who use water.
Overall
, it can be seen that there are six areas North Linking Words
America
, South Use synonyms
America
, Europe, Africa, Central Use synonyms
Asia
and Southeast Use synonyms
Asia
. Use synonyms
In addition
, there are three things to use water Linking Words
such
as industrial, agricultural and domestic.
Linking Words
To begin
with, in three areas Africa, Central Linking Words
Asia
and South East Use synonyms
Asia
using water for agriculture Use synonyms
more
than 80 per Add a missing verb
is more
cent
and Use synonyms
this
is the highest percentage in the three areas. Linking Words
In contrast
, industrial, agricultural and domestic were not more than 12 per Linking Words
cent
.
For North Use synonyms
America
and Europe, the highest was industrial about 53 per Use synonyms
cent
and 43 per Use synonyms
cent
respectively. Use synonyms
On the other hand
, South Linking Words
America
Use synonyms
was
only 10 per Verb problem
had
cent
of industrial, but the highest was agricultural.Use synonyms