
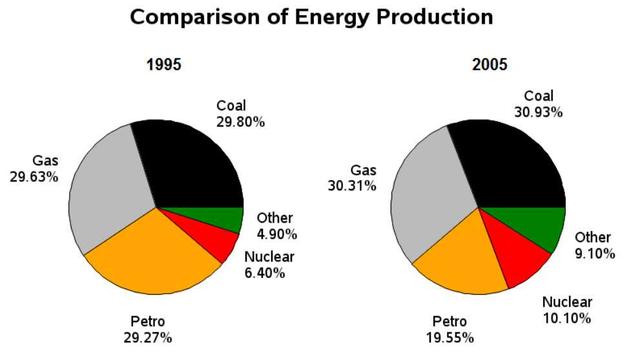
The diagrams demonstrate the differences between
energy
consumption proportions from distinct sources in France in 1995 and 2005. Use synonyms
Overall
, Linking Words
it is clear that
Coal was the most famous Linking Words
energy
generator. Use synonyms
Moreover
, Linking Words
while
coal, Gas, Nuclear and other sources were used more for Linking Words
energy
production, the figure for Petro dwindled.
Focusing on the year 1995, Coal was utilized the most for Use synonyms
energy
production with a perception of 29.8. Use synonyms
Moreover
, Gas stood in the second place for the same count with 29.63% of all. Linking Words
Furthermore
, we have petro resources which were 29.27% used in the same year and Linking Words
lastly
, Nuclear and other sources were consumed the least at just under 10 per cent.
Moving on to 2005, Linking Words
although
coal and gas stayed at the top for Linking Words
energy
-related consumption, Petro was less famous Use synonyms
this
year at approximately 20 per cent. Linking Words
However
, Nuclear and other resources accumulated slightly to just nearly 10 per cent.Linking Words