
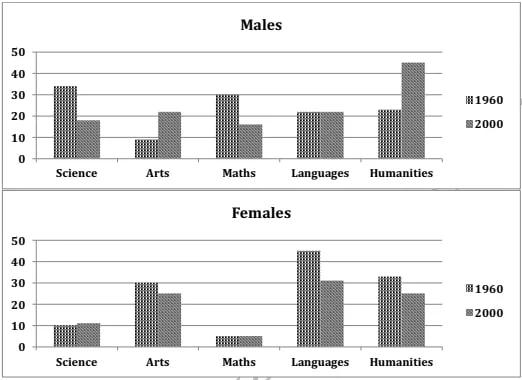
These two graphs compare students
according to
the highest Linking Words
grades
in the Use synonyms
years
1960 and 2000.
The charts describe separately the Use synonyms
men
and the Use synonyms
women
, and their marks in five different objects - Use synonyms
science
, Use synonyms
arts
, Use synonyms
maths
, languages and humanities.
The Use synonyms
men
had higher Use synonyms
grades
in Use synonyms
science
and Use synonyms
maths
in 1960 compared to 2000. In Use synonyms
arts
and Use synonyms
humanities
the Add a comma
humanities,
men
were better in the year 2000. They got the same marks in Use synonyms
both
Use synonyms
years
.
In the Use synonyms
Use synonyms
women
the situation was completely different. They were assessed by higher Add a comma
women,
grades
in Use synonyms
arts
, languages and humanities in the year 1960. Use synonyms
On the other hand
, they got lower Linking Words
grades
in Use synonyms
science
, and the same grade in Use synonyms
maths
.
Generally speaking, the Use synonyms
women
were assessed with better Use synonyms
grades
in 1960; Use synonyms
science
and Use synonyms
maths
were not preferred objects. In the group of Use synonyms
Use synonyms
men
there were Add a comma
men,
the
constant changes in the height of Correct article usage
apply
grades
, the lowest grade they got in Use synonyms
arts
in 1960.
Use synonyms
To conclude
, only languages in Linking Words
men
and Use synonyms
maths
in Use synonyms
women
were assessed by the same Use synonyms
grades
in Use synonyms
both
Use synonyms
years
, Use synonyms
while
in the other Linking Words
subjects
there were many changes during Add a comma
subjects,
both
Use synonyms
years
in Use synonyms
both
sexes.Use synonyms