
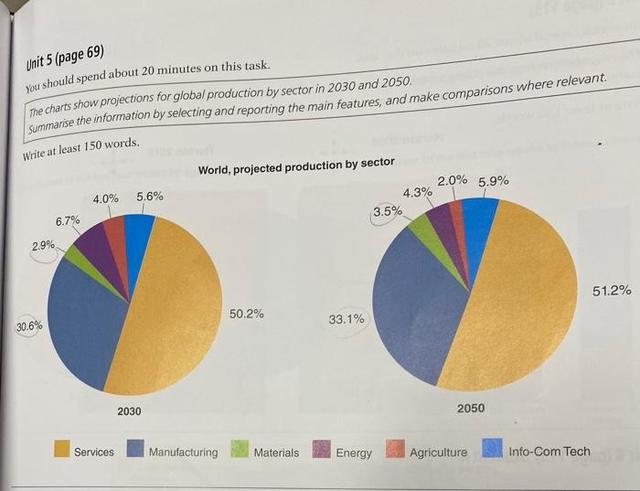
The pie charts above display the projected world productions in 2040 and in 2060.
Overall
, it is clear to see that the majority of productions are by services and manufacturing resources in both years. Linking Words
Whereas
, sectors Linking Words
such
as Linking Words
Agriculture
, Use synonyms
Energy
and materials make the least contribution. Use synonyms
Moreover
, all sectors apart from Linking Words
agriculture
and Use synonyms
energy
, will have a slight elevation in production.
Services are the leading cause Use synonyms
for
global waste in both 2040 and 2060; Change preposition
of
the
figure increasing by 1% from 40 to 41%.Change preposition
with the
This
is followed by manufacturing which will experience a 2% increase from 31 to 33 over the course of the 20 years. Info-Com Tech will Linking Words
also
demonstrate a rise of 1%, the figures growing from 15 to 16 respectively.
Linking Words
On the other hand
, both Linking Words
Agriculture
and Use synonyms
Energy
will decline over Use synonyms
this
time period. Out of all the sources, Linking Words
Agriculture
will have the greatest fall from 4% to 1% in 2060. Use synonyms
This
is closely followed by Linking Words
Energy
which will Use synonyms
also
decrease from 7 to 5. The generation of materials will have a small jump from 3 to 4.Linking Words