
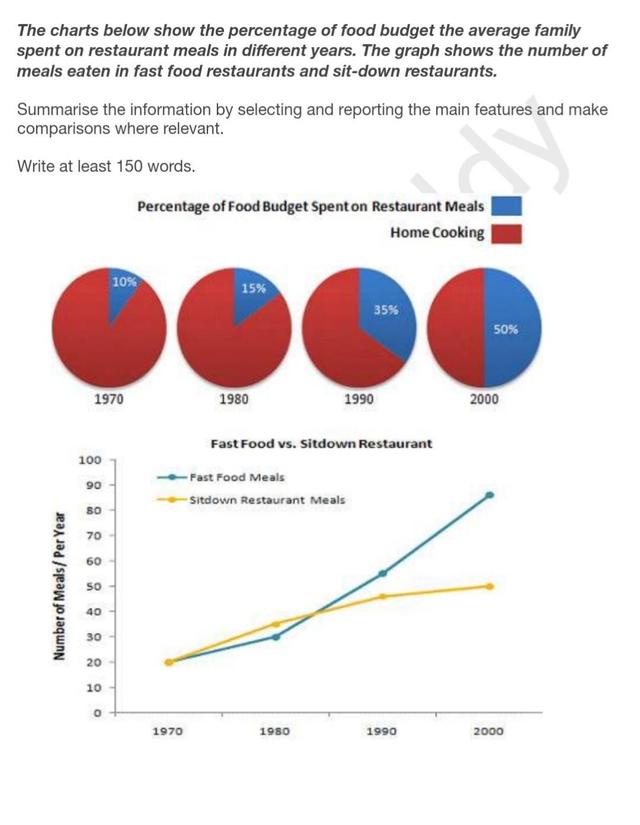
The pie chart displays the proportion of the average money spent on
meals
by some families over the period of 30 years and the bar chart illustrates how much melas have been eaten compared to fast Use synonyms
food
and general restaurants from 1970 to 2000.
Use synonyms
Overall
, home cooking increased over 30 years, with 1970 having a much higher percentage than any other year in five periods. From 1970 to 2000. there is an upward trend in both fast Linking Words
food
and sit-down restaurant Use synonyms
meals
, but fast Use synonyms
food
still has a significant majority.
In 1970, home cooking was the highest feature that people spent money on with a percentage of 90% and Use synonyms
then
there was a slight decrement to 85% in 1980, but was still higher than restaurant Linking Words
meals
. Use synonyms
Finally
, it reached the smallest point at 50%, which was a similar rate to having Linking Words
meals
at a restaurant in 2000.
In 1970, Use synonyms
meals
from both fast Use synonyms
food
and sit-down places represented the same figure as 20 times, Use synonyms
nevertheless
, the rate of having junk Linking Words
meals
service dramatically increased to approximately 90 times a year in 2000. Use synonyms
However
, at the same time, Linking Words
meals
at conventional restaurants were half from just 50 times a year.Use synonyms