
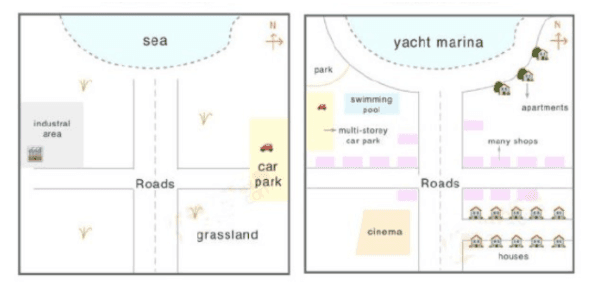
Two maps visually illustrate the transformation of a coastal town named Petland, from 1950 to 2007.
Overall
, the place has become more urbanised than 57 years ago. There are a few facilities for the community and some places related to the farming business have been demolished.
Linking Words
To begin
with, at the moment, there is a yacht marina docked on the seaside. Linking Words
Next,
in the northeast, apartments have been built. And go to the east, many shops added, Linking Words
while
the car park has been removed from there. Moving to the southeast, houses had been constructed on the grassland.
If we walk across the road, In the southwest, there is a new cinema replacing the cornfield. Linking Words
Then
, the multi-storey car park was moved to the west, and a swimming pool was added to Linking Words
this
side as well, Linking Words
whereas
the industrial area is no longer on Linking Words
this
coast. Linking Words
Finally
, on the left corner, a park had been formed at the left corner.Linking Words