
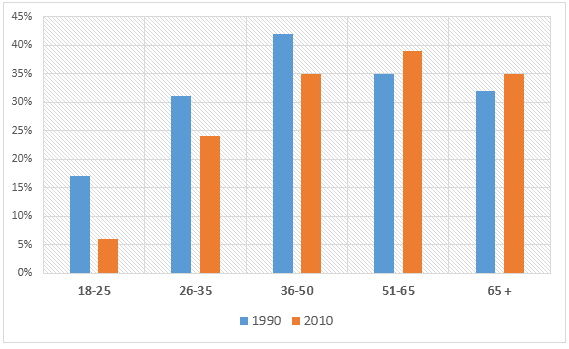
The provided chart illustrates data about how much money was donated by categorizing
age
groups of British people in comparison from 1990 to 2010. Use synonyms
Overall
, what stands out from the chart is that people gave more money to charity in 1990 than in 2010, except the senior Linking Words
citizen
above 51 Fix the agreement mistake
citizens
years
old.
Looking at the details, people in the Use synonyms
age
up to 50 Use synonyms
has
significantly Correct subject-verb agreement
have
drop
the amount of charity by Change the verb form
dropped
average
of 5%. The Add an article
an average
age
group of 36 to 50 Use synonyms
years
old made charitable donations just above 40% in 1990, Use synonyms
made
it to the highest percentage across the Wrong verb form
making
age
groups. Use synonyms
Then
, the figure drops significantly by 7% to 35%.
Meanwhile, the youngsters (Linking Words
age
18 to 25) donated from 17% to 7% two decades later, placing them Use synonyms
the
Change preposition
in the
least
percentage of Correct word choice
lowest
donation
made. Fix the agreement mistake
donations
In contrast
, Linking Words
51
Correct article usage
the 51
years
old and above Use synonyms
citizen
rose remarkably by Fix the agreement mistake
citizens
average
of 6%. Add an article
an average
Initially
, the 51-65 Linking Words
years
old group had 35% Use synonyms
donation
, after rocketing to 40%, it placed them as the most charitable Fix the agreement mistake
donations
age
group in 2010.Use synonyms