
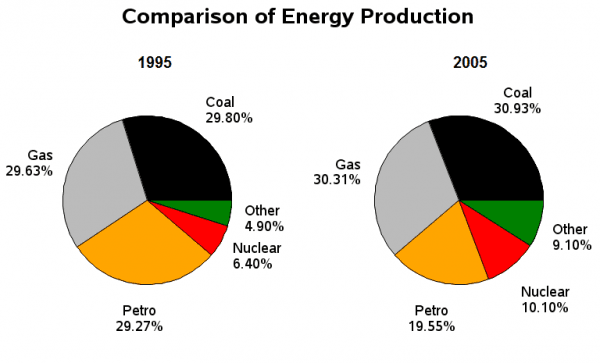
The charts illustrate the proportion of five types of
energy
Use synonyms
production
in France from 1995 to 2005. Use synonyms
Overall
, Gas and Coal had the most significant sources of Linking Words
energy
, around half over the percentage in both years. Use synonyms
While
, Linking Words
petro
and others generated the least amount in Change the capitalization
Petro
energy
Use synonyms
production
, in all types of Use synonyms
energy
there was only minimal change over the Use synonyms
10 year
period.
Add a hyphen
10-year
Energy
produced by Coal comprised 29,80% in 1995 and a slight increase Use synonyms
about
30,93% in 2005. Change preposition
of about
Likewise
, in 1995 Gas the second place Linking Words
of
Change preposition
in
energy
Use synonyms
production
generated 29,63% Use synonyms
in
1995 which rose marginally to 30,31% in 2005.
For the remaining Change preposition
apply
energy
Use synonyms
production
, there was an increased trend of approximately 5% for nuclear and others to 10,10% and 9,10%, respectively. Use synonyms
On the other hand
, Petro which is the only Linking Words
energy
Use synonyms
production
has decreased from 29,27% in 1995 to 19.55% in 2005.Use synonyms