
This
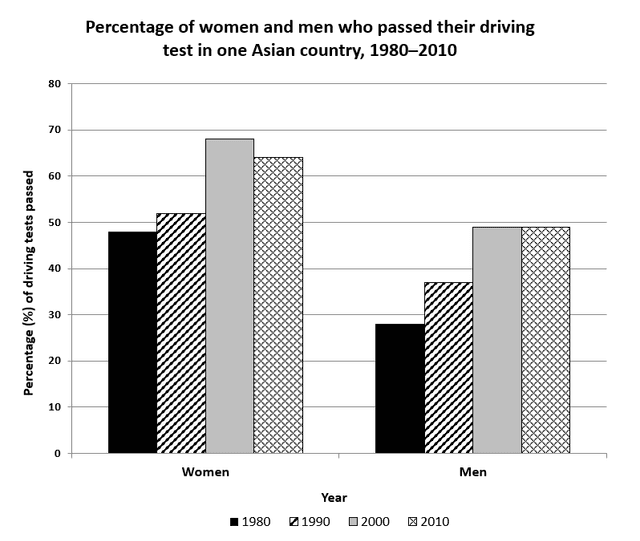
graph elaborates Linking Words
the
percentage of total drivers who got their driving license Change preposition
on the
during
1980 and 2010 divided by Change preposition
between
the
gender. The data for women throughout the Correct article usage
apply
years
shows Use synonyms
a
Correct article usage
apply
fluctuative
numbers Correct your spelling
fluctuating
while
Linking Words
men
's had a stable increase.
The thing that stands out the most is how both women and Use synonyms
men
in 1980 became the least of Use synonyms
Correct article usage
the population
population
that passed the driving test where the data couldn't Correct article usage
the population
suprass
50% of the individuals. More than that, it is Correct your spelling
surpass
suppress
also
obvious to see that females Linking Words
more
likely can drive than Add a missing verb
are more
men
. Use synonyms
This
is because the topmost number Linking Words
lead
the Wrong verb form
led
overall
graphic in the year Linking Words
of
2000 where it was nearly 70% of women could operate Change preposition
apply
the
cars. Correct article usage
apply
Though
, there was a slight decline in 2010 that Correct word choice
However
was
almost made the numbers hit 60%.
Unnecessary verb
apply
On the other hand
, Linking Words
men
started with the lowest number in the Use synonyms
overall
chart with only almost 30% of Linking Words
population
. Add an article
the population
However
, not like how Linking Words
females'
chart showed a decrease, Correct article usage
the females'
men
's showed an upward trend for each Use synonyms
Use synonyms
years
until Change to a singular noun
year
finally
being tied in the two Linking Words
years
. The peak Use synonyms
years
were in 2000 and 2010 Use synonyms
where
two of them placed the highest number with nearly 50% of males certified car Correct word choice
when
driver
.Fix the agreement mistake
drivers