
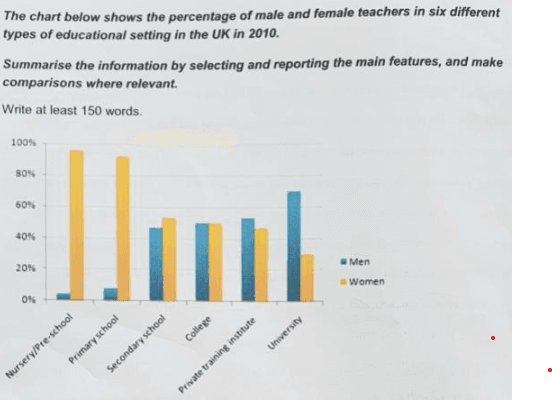
The bar chart presents the proportion of
men
and women instructors in six various educational academies across the UK in 2010.
Totally, Use synonyms
according to
the presented information, in three schools (mostly primary schools) women tutors extremely outnumbered Linking Words
Use synonyms
men
tutors all over the UK. Correct your spelling
male
For instance
, the participation of males Linking Words
are
nearly zero Change the verb form
is
while
it`s about 100 per cent for females. Linking Words
This
gender gap mentions that as the level of the institutes gets higher, the amount of Linking Words
men
teachers increases until it gets the same attendance of both sexes like college.
Use synonyms
On the other hand
, in higher educational systems like universities and private training centres, it`s the opposite. The number of Linking Words
men
is more than women. As an example, the percentage of males pass than females at universities.
As Use synonyms
shows
, the sex gap is severely noticeable in the entire United Kingdom`s school settings. As the degree goes up, the quantity of instructors changes in different educational organizations.Wrong verb form
shown