
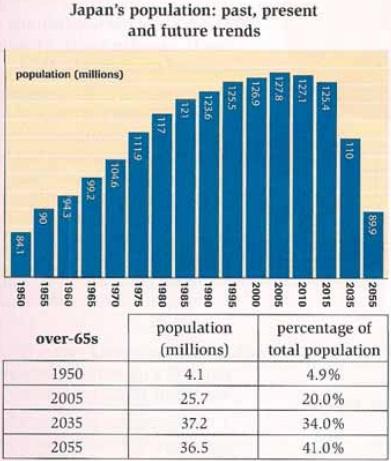
The given bar graph and table show the data of
Japan
Change noun form
Japan's
population
between 1950 and Use synonyms
prediction
Correct article usage
the prediction
on
2055 and the table Change preposition
for
illustrate
the proportion of Japanese people in age over Correct subject-verb agreement
illustrates
than
65s. The units were measured in millions and Change preposition
apply
percentage
of Fix the agreement mistake
percentages
total
Add an article
the total
population
.
Use synonyms
Overal
, it can be clearly seen the Correct your spelling
Overall
population
Use synonyms
was
increased gradually until 2005 and afterwards the figure will Unnecessary verb
apply
dropped
significantly. Meanwhile, the proportion and percentage of senior citizens over 65 was Change the verb form
drop
rise
and predicted will grow Wrong verb form
rising
significanly
.
As the graph shows, from 1950 to 2005, the number of Correct your spelling
significantly
population
Use synonyms
was grew
gradually from 84.1 to its peak point at 127.8. Change the verb form
grew
Subsequently
, in 2010 and 2015, the figure began to Linking Words
dropped
Change the verb
drop
at
127.1 and 125.4, respectively. Change preposition
to
Moreover
, the predictions of Linking Words
Use synonyms
population
will go down in 2035 Add an article
the population
at
110 and Change preposition
to
2055
Change preposition
in 2055
at
89.9.
Regarding the table of Change preposition
to
old
people Correct word choice
apply
with
over 65s years old, in 1950 the total Correct word choice
apply
was
accounted for 4.1 Unnecessary verb
apply
millions
or 4.9% of Change to singular
million
total
Add an article
the total
population
. After 55 years, the figure Use synonyms
was
rose more than six times to 25,7 Unnecessary verb
apply
millions
and 20 of Change to singular
million
total
Add an article
the total
population
. In the future, the projection of Use synonyms
this
age group will Linking Words
rocketed
to 37.2 in 2035 and 36.2 in 2055. The share of elderly people Change the verb form
rocket
be rocketed
also
increased to 34% and 41%.Linking Words