
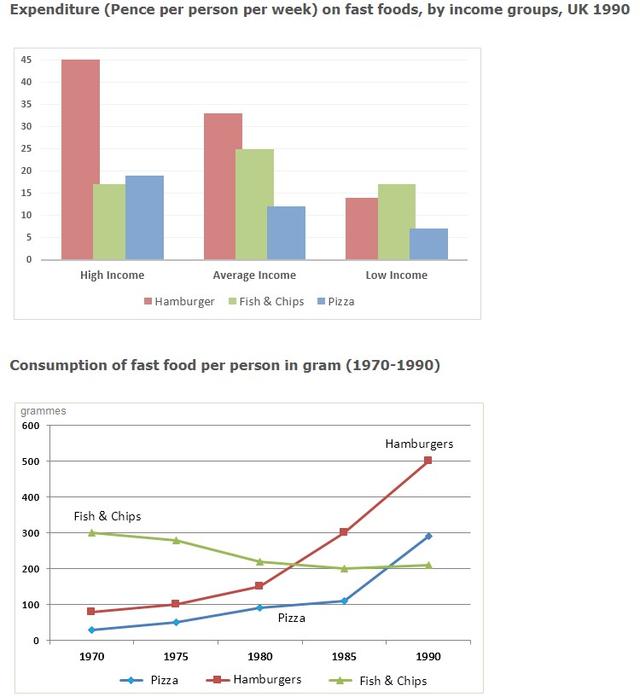
The bar chart illustrates the expenditure on fast foods, namely
Hamburgers
, Use synonyms
fish
and Use synonyms
chips
, and Use synonyms
pizza
every week with Use synonyms
pence
person in accordance with socio-economic status in Britain and the line graph provides information about the Use synonyms
grammes
of consumed processed foods from 1970 till 1990.
It is clearly seen that Use synonyms
hamburgers
were Use synonyms
such
famous foodstuffs among high and average income groups that consumption was the highest in Linking Words
grammes
during two decades.
Consumers who earned highly spent about 45 Use synonyms
pence
during a week and purchased Use synonyms
fish
and Use synonyms
chips
and Use synonyms
pizza
differentiated only roughly 3 Use synonyms
pence
. Average and high-income groups bought Use synonyms
pizza
and Use synonyms
hamburgers
for nearly the same amount of money about 13 Use synonyms
pence
. Medium income group allocated their large amount of money on Use synonyms
hamburgers
and Use synonyms
fish
and Use synonyms
chips
34 and 25 Use synonyms
pence
every week, Use synonyms
however
, the great expense of low-income people lay on Linking Words
fish
and Use synonyms
chips
similar Use synonyms
with
high-income people.
In 1970 Change preposition
to
hamburgers
and Use synonyms
pizza
were eaten under 100 Use synonyms
grammes
approximately 80 and 40 respectively Use synonyms
whereas
both types of these fast food went through increases in the next years. In 1983 consumption of Linking Words
hamburgers
exceeded Use synonyms
fish
and Use synonyms
chips
with above 200 grammars. Use synonyms
As well as
eaten Linking Words
pizza
Use synonyms
grammes
outstripped Use synonyms
fish
and Use synonyms
chips
in 1989. Use synonyms
At the end
of the period, Linking Words
hamburgers
reached the highest 550 Use synonyms
grammes
on consumption.Use synonyms