The charts below show the results of a questionnaire that asked visitors to the Parkway Hotel how they rated the hotel's customer service. The same questionnaire was given to 100 guests in the years 2005 and 2010. Summarise the information by selecting and reporting the main features and make comparisons where relevant. You should write at least 150 words.

The charts below show the results of a questionnaire that asked visitors to the Parkway Hotel how they rated the hotel's customer service. The same questionnaire was given to 100 guests in the years 2005 and 2010.

Summarise the information by selecting and reporting the main features and make comparisons where relevant.

You should write at least 150 words.
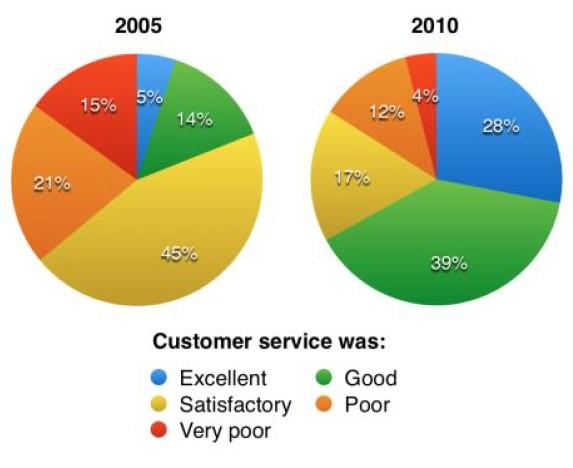
The pie charts below show the results of a survey of 100 hotel guests about the service provided by the Parkway Hotel.
Aditionally
Correct your spelling
Additionally
, the data is compared between 2005 and 2010.
Overall
, it can be clearly seen from the graph that a good rating of the hotel's service has increased significantly over the whole period of the study, from satisfactory to good and excellent. Looking at the first pie chart, it can be seen that about half of the consumers gave a satisfactory rating, 45%,
while
the second category of rating was poor and very poor, 21% and 15% respectively. As can be seen from the graph, the number of people who gave excellent comments was only 5%, twice as many as good with 14%. Looking more closely at the second chart, it can be seen that satisfied customers fell to 17%,
while
customers with good and excellent ratings were three times higher than in previous research, 39% and 25% respectively.
As a result
, the number of poor and very poor customers has doubled to 12% and 4% respectively.
Submitted by santos_dij on

Unauthorized use and/or duplication of this material without express and written permission from this site’s author and/or owner is strictly prohibited. Excerpts and links may be used, provided that full and clear credit is given to Writing9 with appropriate and specific direction to the original content.

Linking words: Don't use the same linking words: "while".
Vocabulary: Rephrase the word "show" in your introduction.
Vocabulary: The word "charts" was used 3 times.
Vocabulary: The word "graph" was used 2 times.
Vocabulary: The word "gave" was used 2 times.
Vocabulary: The word "number of" was used 2 times.
Vocabulary: The word "about" was used 2 times.
Topic Vocabulary:
  • customer service
  • questionnaire
  • survey
  • respondents
  • rating scale
  • hospitality
  • customer satisfaction
  • comparison
  • data
  • trends
  • improvement
  • deterioration
  • feedback
  • service areas
  • hospitality industry
  • guest experience
  • satisfaction level
  • to rate
  • significant
  • frequency
  • percentage
  • chart
  • bar graph
  • pie chart
  • analysis
  • conclusion
What to do next:
Look at other essays: