
Above data shows
computer
ownership and education level by 2002~2010. Use synonyms
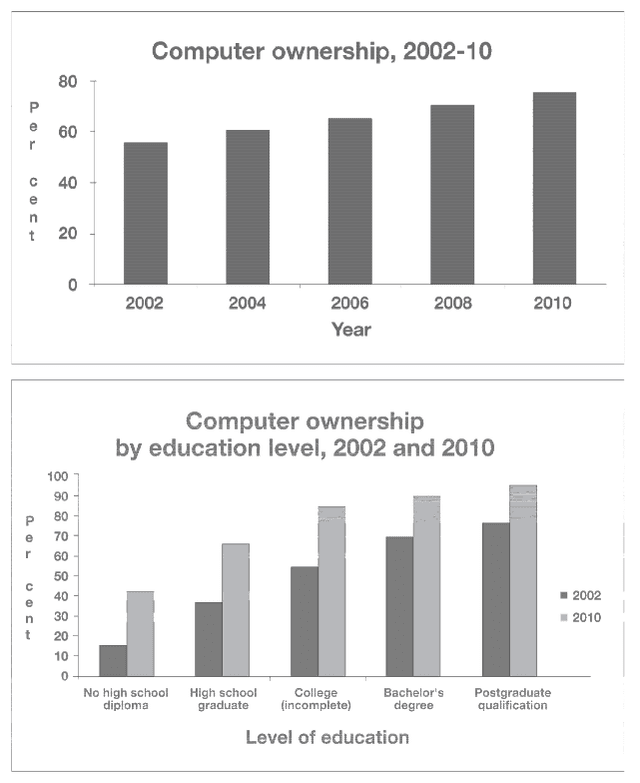
Overall
, all of grahps are getting higher than the past year.
In the Linking Words
computer
ownership, the percentage of 2002 was almost 60% and it growed up by every year. The middle grahp: 2006 is higer Use synonyms
then
60% and the Linking Words
last
graph: 2010 is bellow Linking Words
then
80%. So, 2002 up to 2010 almost 30% of Linking Words
computer
ownership growed up.
Next in level of education, both bars 2002 and 2010 was the least percentage at "No high school diploma" and the highest percentage was "Postgraduate qualification" for both graphs. All of the graphs appers, when people get higher education levels the Use synonyms
computer
ownerships are increasing beside it.Use synonyms