
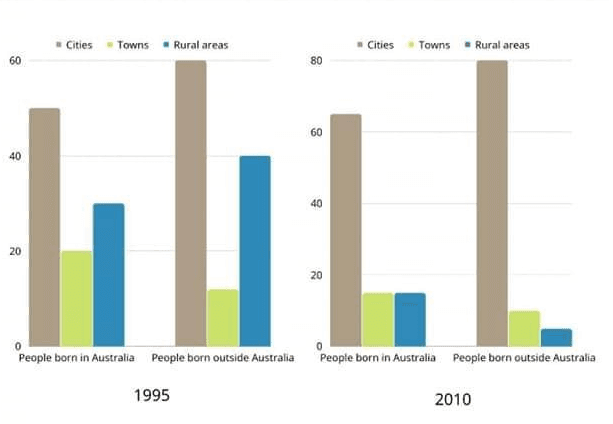
The bar charts illustrate the difference between 1995 and 2010 in the proportion of
people
born in Use synonyms
Australia
and born outside Use synonyms
Australia
in terms of a place to live. Use synonyms
Overall
, the charts display a similar pattern with living in cities dominating for both groups.
Linking Words
To begin
with, since 1995, living in cities has already been preferred by Linking Words
people
who were born in Use synonyms
Australia
and outside Use synonyms
Australia
. Both groups presented more than 50 Use synonyms
percent
of the Change the spelling
per cent
overall
population. In 2010, the percentage increased to more than three-fifths for the Australian-born Linking Words
people
Use synonyms
group
, and to four-fifths for the Use synonyms
group
of Use synonyms
people
born outside Use synonyms
Australia
.
Use synonyms
In contrast
, the two remaining places show different trends. The percentage of Linking Words
people
who were born in Use synonyms
Australia
living in towns stood at 20% and gradually decreased to 10%. For the other Use synonyms
group
, only a slight drop from 10% to about 7%. The rural areas show a higher proportion compared to towns in 1995, but the percentage significantly fell by 20% in the Australian-born Use synonyms
people
Use synonyms
group
and plunged to 5% from 40% in the Use synonyms
group
of Use synonyms
people
born outside Use synonyms
Australia
.Use synonyms