
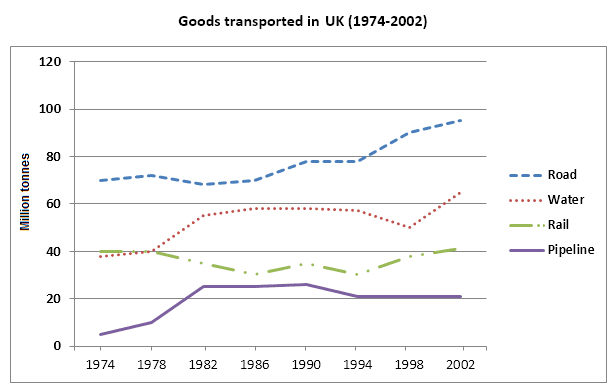
The line chart demonstrates how many products were transported via four different methods of transportation in the UK over a twenty-eight-year
period
from 1972 to 2000.
Use synonyms
Overall
, what stands out from the graph is that Linking Words
although
transporting by road was the most popular mode, Linking Words
this
figure for pipeline was the Linking Words
least
over the Correct word choice
lowest
period
in question.
Use synonyms
Also
evident is, in 1972 water and rail as the two means of transportation were Linking Words
same
in popularity at about 40 million tonnes. Correct article usage
the same
however
, despite the fact that the former rose considerably to over 60 in 2000, the alter Linking Words
fluctuaded
over the studied Correct your spelling
fluctuated
fluctuate
period
and Use synonyms
at the end
of Linking Words
Use synonyms
period
got back to 40.
As can be seen, in 1992 Add an article
the period
Correct article usage
the counts
counts
Fix the agreement mistake
count
for
Change preposition
of
Add an article
the pipeline
pipeline
was just over 0 and after a sharp climb in Fix the agreement mistake
pipelines
1976
it increased to around 20, Add a comma
1976,
whereas
, it stayed fixed by 2000. Linking Words
Conversly
, Correct your spelling
Conversely
road
witnessed a sharp increase from about 70 and peaked at just under 100 in 2000 and remained the most popular Fix the agreement mistake
roads
mean
of transportation over the mentioned Fix the agreement mistake
means
period
.Use synonyms