
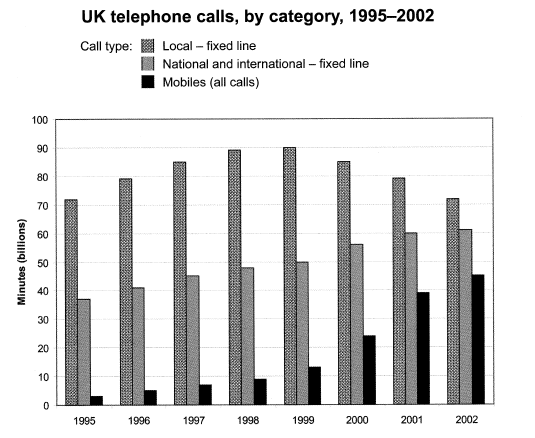
The graph demonstrates how many
billion
minutes the UK citizens devoted to making phone calls Use synonyms
via
three different ways over a seven-year period between 1994 and 2001.
Change preposition
in
Overall
, what stands out from the graph is that Linking Words
although
both the mobile calls and national and international - fixed Linking Words
line
calls witnessed a significant rise throughout the period in Use synonyms
the
question, local - fixed Correct article usage
apply
line
calls fell back to Use synonyms
its
starting point after a gradual increase.
As can be seen, in 1994 the local - fixed Correct pronoun usage
their
line
calls were responsible for the major part of phone calls at 70 Use synonyms
billion
minutes, Use synonyms
however
, Linking Words
the
mobiles were the least popular among the residents, Correct article usage
apply
in other
Linking Words
words
they were used about 3 Add a comma
words,
billion
Use synonyms
minuets
. Correct your spelling
minutes
Moreover
, Linking Words
while
Linking Words
in1998
the use of three types of calls climbed to different extents, the local - Change preposition
in in1998
fixed
Correct your spelling
-fixed
line
peaked at 90 Use synonyms
billion
and the national and international - Use synonyms
fixed
Correct your spelling
-fixed
line
rose steadily to 50. Use synonyms
Besides
that, the counts for Linking Words
mobiles
calls were almost Change the noun form
mobile
one tenth
of the local - fixed lines in 1998.
Another important fact is that after 1998 both the mobiles and the national and international -fixed lines grew Add a hyphen
one-tenth
thus
, they soared to around 45 and 60 Linking Words
billion
minutes respectively. Use synonyms
In contrast
, the figures for Linking Words
local
- fixed Correct article usage
the local
line
dropped to 70. Use synonyms
Also
, by the end of the studied Linking Words
period
the degree of differences between the three categories shrank.Add a comma
period,