
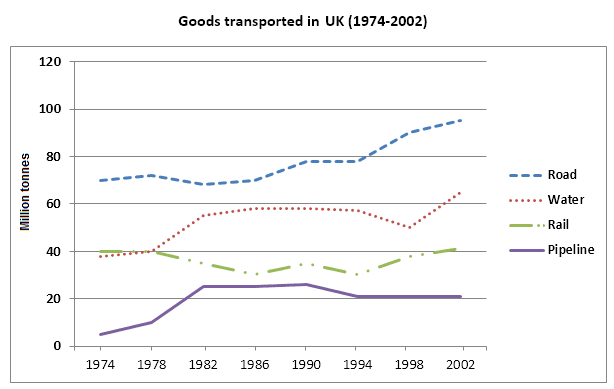
The line graph reveals data about the
quantities
of Use synonyms
goods
transported in the United Kingdom by various methods of transportation systems (road, water, rail pipeline) From 1974 to 2002.
Use synonyms
Overall
, what stands out from the graph is that there are significant upward trends in the rates of Linking Words
goods
transported by road, water and pipelines, Use synonyms
while
the portion transported by rail remained almost constant over the period of Linking Words
question
:
The most considerable Add an article
the question
a question
quantities
of in the Uk both Use synonyms
quantities
of products transported were by road (70 in 1974 and 2002 were 70 Use synonyms
million
Use synonyms
tonnes
and 98 Use synonyms
million
tones respectively), Use synonyms
while
the lowest in bath 1947 and 2.02 were by pipeline (about 5 Linking Words
million
Use synonyms
goods
and just over 20 Use synonyms
million
good respectively. Use synonyms
Also
, it is interesting to mention that all types of transporting Linking Words
quantities
decreased slightly in 1994 except the pipeline, which improved to about 21 Use synonyms
million
Use synonyms
tonnes
.
The number of Use synonyms
goods
transported by rail was almost constant at 40 Use synonyms
million
Use synonyms
tonnes
in 1994 and 2002, with a fluctuation in the Use synonyms
quantities
over, over the period. The proportion of Use synonyms
goods
transported by water Was in the third rank in 1974 lat 30 Use synonyms
million
times); Use synonyms
However
, There was considerable growth over the period (at approximately 62 Linking Words
million
Use synonyms
tonnes
.).Use synonyms