
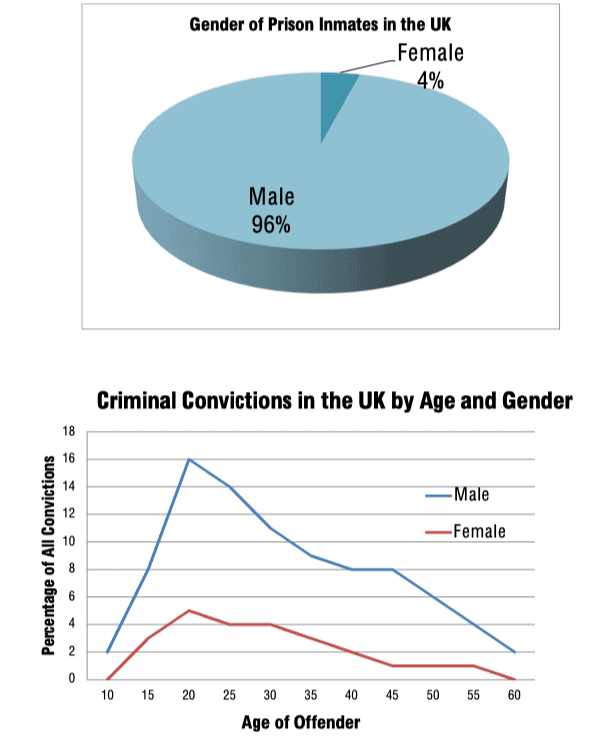
The line graph and pie chart provides the trend of
overall
Linking Words
crime
in the Use synonyms
last
year in UK. Linking Words
Moreover
, the Pie chart present kind of Linking Words
crime
which is categorized by 4 kind, Use synonyms
such
as violent Linking Words
crime
, property Use synonyms
crime
, drug Use synonyms
crime
, and public order Use synonyms
crime
. British Use synonyms
crime
trend is shown on the line graph by number of Use synonyms
crime
and Use synonyms
age
.
Use synonyms
Overall
, Linking Words
according to
considering the criminal Linking Words
age
, was the highest in amoung the younger people, Use synonyms
whereas
violent Linking Words
crime
of total recorded crim was notable great at 46%.
In contras, Use synonyms
according to
the pie chart, most common Linking Words
crime
in UK estimated violent Use synonyms
crime
(46%) , followed by propery rubbery (23%)and drug related case (22%) , despite the lowest amount of cases were public ordder related (9%).
Use synonyms
On the other hand
, number of Linking Words
crime
(tens of ) recorded notable on Use synonyms
age
between 16-24 Use synonyms
such
as 800 Linking Words
thousands
cases recorded among 20 years old people, 700 Use synonyms
thousands
case related to the 16 years and 600 Use synonyms
thousands
case related to the 16 years. The least amount of Use synonyms
crime
rate was during the Use synonyms
age
between 44-60, involving less than 100 Use synonyms
thousands
of recorded Use synonyms
crime
in Use synonyms
last
year.Linking Words