
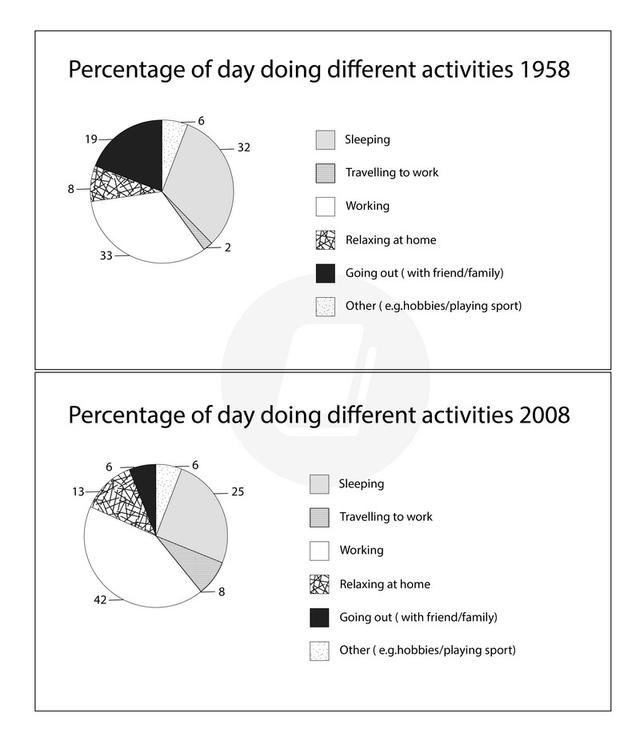
The pie charts
provides
information about the proportion of Change the verb form
provide
time
spent by working people on various activities in one country in 1958 and 2008.
Use synonyms
Overall
, the major part of these charts belongs to working persons with the tendency of growth over Linking Words
the
Correct article usage
apply
time
. Use synonyms
Also
, a Linking Words
noticible
decline Correct your spelling
noticeable
for
sleeping activity Change preposition
in
shown
. Add a missing verb
is shown
In contrast
, people started to spend more Linking Words
time
on getting relaxed at home.
In 1985, the figure Use synonyms
of
Change preposition
for
working
adults category Correct article usage
the working
accounts
for 33% and, by 2008, the Wrong verb form
accounted
numbers
increased Fix the agreement mistake
number
up
to 42%. Other part of the chart like "sleeping" demonstrates a slight decrease from 32% in 1985 to 25% in 2008. Notably, In 2008, a number of people had more spare Change preposition
apply
time
for Use synonyms
relaxesion
at home which is illustrated by Correct your spelling
relaxation
fall
Correct article usage
a fall
with
8% Change preposition
of
comparing
to 12% in 1958.
Other categories represent the smaller part of the data where Wrong verb form
compared
bigger
number of adults started to travel more in 2008 with 8% to 2% in 1958. Add an article
a bigger
the bigger
However
, going out activity decreased significantly in 2008 compared to 1958 with 6% and 19% respectively.Linking Words