
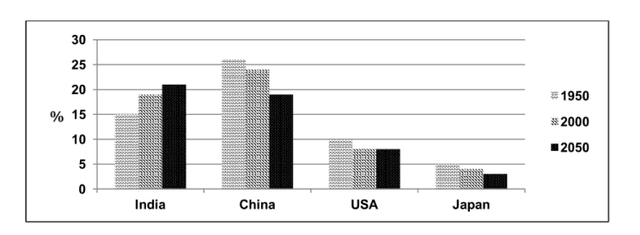
The given column chart illustrates the proportion of the global population in different countries during a hundred-year period since 1950. We can see that, japan accounted for the least amount of the
volume of people in all years.
Moving onto details, it is seen that China,
USA
and Japan experienced a downward trend in terms of population Correct article usage
the USA
in
1950 and 2000. China fell from just above 25% to well above 15% in 2050. The amount of population in Japan was almost halved in comparison with usa in the corresponding years.
Change preposition
between
On the other hand
, India showed a moderate upward trend from 15% in 1950 to just above 20% in 2050.Linking Words