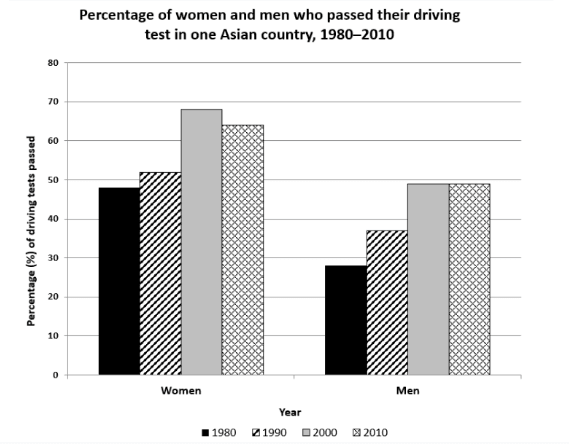
The chart shows the percentage of women and men in one Asian country who passed when they took their driving test between 1980 and 2010. Summarise the information by selecting and reporting the main features, and make comparisons where relevant.

The chart shows the percentage of women and men in one Asian country who passed when they took their driving test between 1980 and 2010.

Summarise the information by selecting and reporting the main features, and make comparisons where relevant.
The chart below
illustartes
Correct your spelling
illustrates
the report of driving
test
Fix the agreement mistake
tests
show examples
between different genders in one Asian country who could
got
Change the verb form
get
be got
show examples
driving
Correct article usage
a driving
show examples
license in different four years.
Overall
,
it is clear that
, in 2000 women had the highest per cent.
According to
the chart, in 1980 nearly 50 % of women passed the
test
while
in that year about 30% of men got the license.
In addition
, in 2000 approximately 70% of
female
Fix the agreement mistake
females
show examples
passed the
test
whereas
in that year almost 50% of
male
Fix the agreement mistake
males
show examples
passed the
test
.
Also
, in 2000 and 2010 men had the same per cent about 50%.
Moreover
, it is obvious that,in 1990 men
about
Add a missing verb
were about
show examples
15% more than
from
Change preposition
in
show examples
1980. In conclusion, as you can see, the highest rate is
blonged
Correct your spelling
belonged
to the women in 2000.
In addition
, the lowest per cent is
blonged
Correct your spelling
belonged
to the male in 1980.
Submitted by bazarjanimohammadreza83 on

Unauthorized use and/or duplication of this material without express and written permission from this site’s author and/or owner is strictly prohibited. Excerpts and links may be used, provided that full and clear credit is given to Writing9 with appropriate and specific direction to the original content.

Linking words: Don't use the same linking words: "in addition".
Introduction: The introduction is missing.
Introduction: Change the first sentence in the introduction.
Introduction: The chart intro is missing.
Common mistake: Your writing should be 150-250 words.
Basic structure: Change the fourth paragraph.
Introduction: The chart intro is missing.
Vocabulary: Replace the words test with synonyms.
Vocabulary: Only 5 basic words for charts were used.
Vocabulary: The word "chart" was used 2 times.
Vocabulary: The word "about" was used 3 times.
Vocabulary: Use several vocabularies to present the data in the second paragraph.
Vocabulary: Use several vocabularies to present the data in the fourth paragraph.
Topic Vocabulary:
  • Percentage
  • Pass rate
  • Driving test
  • Trend
  • Increase
  • Decrease
  • Milestone
  • Comparison
  • Significant difference
  • Broad social changes
  • Policy changes
  • Surpass
  • Reflect
  • Implications
  • Disparity
  • Overall trends
  • Summarize
  • Statistical data
What to do next:
Look at other essays: