
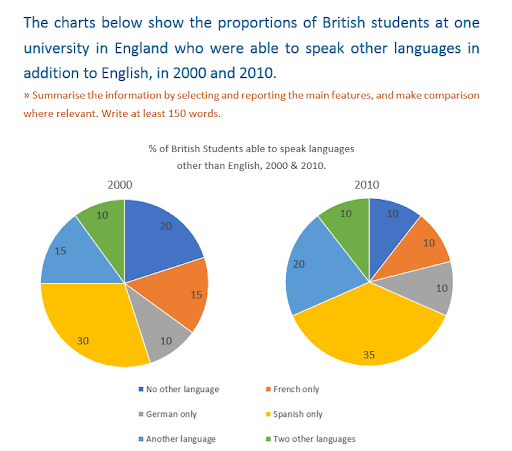
The pie charts below illustrate the distribution of how many British people are able to speak in other languages over the ten-year period.
Overall
, there was a major change in most of the population. Within six of the Linking Words
language
distributions, five of them have a fluctuated shift, Use synonyms
along with
one Linking Words
language
data that has remained the same since 2000.
The share of Spanish, which was the most popular choice at the outset of the period, experienced a significant increase of 5% in 2010. Use synonyms
Likewise
, the same amount of growth happened to the Another Linking Words
Language
and Two Other Use synonyms
Language
, evolving from 15% and 10% to 20% and 15% respectively.
As the second highest percentage, No Other Use synonyms
Language
had a sharpest decline of 10% after 10 years. Following that, a specific drop of 5% encountered the Spanish proportion. Use synonyms
However
, different from the others, Linking Words
German
remained steady over the ten years with a 10 per cent ratio.Replace the word
Germany