
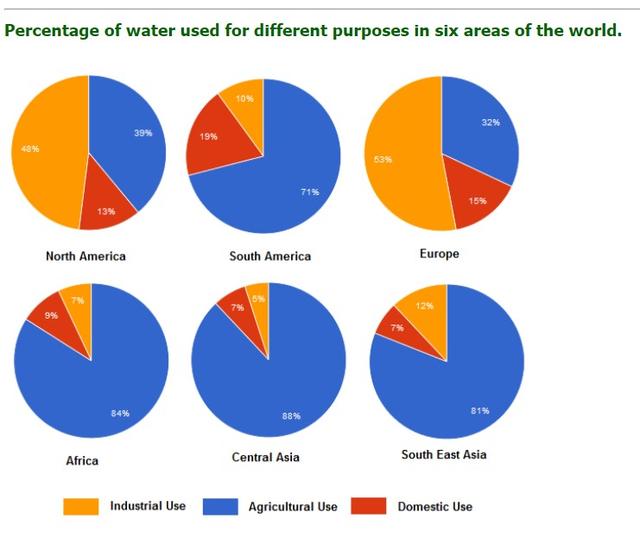
The pie charts compare the
water
consumption of different Use synonyms
Use synonyms
use
including industrial Fix the agreement mistake
uses
use
, agricultural Use synonyms
use
and domestic Use synonyms
use
in six countries Use synonyms
including
North Change preposition
apply
America
, South Use synonyms
America
, Use synonyms
Europe
, Africa, Central Use synonyms
Asia
and South Use synonyms
Asia
.
Use synonyms
Overall
, the vast majority of Linking Words
water
was consumed in agriculture whilst that in Use synonyms
Europe
and North Use synonyms
America
was in industry.
Use synonyms
According to
the information shown in the graph, over 70% of Linking Words
water
was used in agriculture except for North Use synonyms
America
and Use synonyms
Europe
which was 39% and 32% only. Use synonyms
By contrast
, their industrial Linking Words
water
expenditure was superior to the rest four countries which was 48% and 53% as much as ten times that in Central Use synonyms
Asia
. Use synonyms
Besides
, domestic Linking Words
water
Use synonyms
use
was higher than industrial Use synonyms
use
in South Use synonyms
America
, Africa and Central Use synonyms
Asia
. What should be particularly mentioned is that the Use synonyms
water
distribution in North Use synonyms
America
was considerably similar to that in Use synonyms
Europe
.Use synonyms