
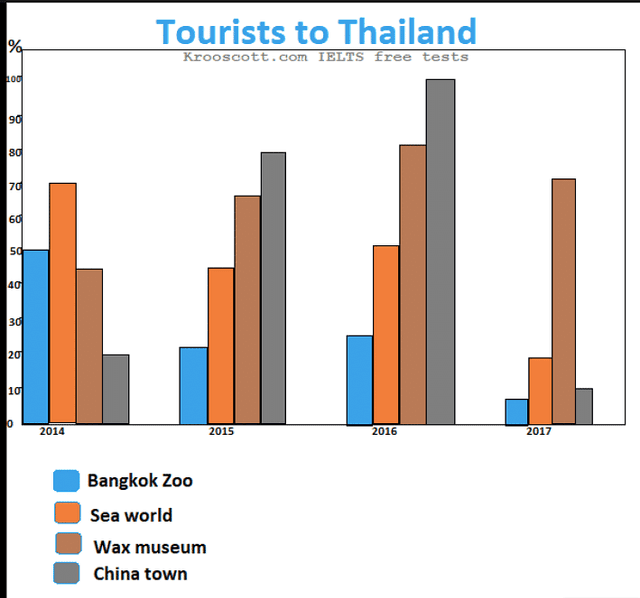
The bar chart illustrates the possibility of people who have visited several different places in Thailand in four ages.
Overall
, It is clear from the graph above that in 2016 Chinatown had the highest percentage among the other spots. Linking Words
While
the same place was selected to be the lowest in 2017.
Linking Words
According to
what is shown the most attractive places every single year have been noticed to be the Sea World, China Town and the Wax Museum, in the years 2014, 2016 and 2017 respectively. Linking Words
Furthermore
, the Chinese town had a significant increase in proportion starting in 2014 until 2016 with an invincible amount of people, 100 %, followed by an enormous decrease that reached 8 % in 2017.
Linking Words
On the other hand
, the Wax Museum has an average rate between the other zones among other years. Linking Words
Moreover
, In the Linking Words
last
three years, the Bangkok Zoo has presented the least attractive places which consume a minimum number of visitors and it should be encouraged.Linking Words