The graph below gives information from a 2008 report about consumption of energy in the USA since 1980 with projections until 2030. Summarise the information by selecting and reporting the main features, and make comparisons where relevant.

The graph below gives information from a 2008 report about consumption of energy in the USA since 1980 with projections until 2030.

Summarise the information by selecting and reporting the main features, and make comparisons where relevant.
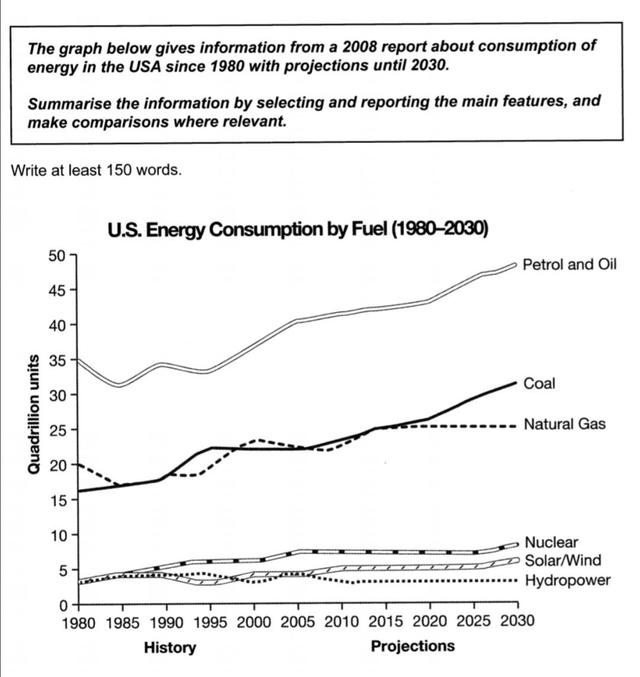
The graph compares how amount of different types of fuel consumed in the USA from 1980 to 2030.
Overall
, of the six types of fuel, petrol and oil are the most prominent items.
However
, the figures for nuclear, solar/wind
,
Remove the comma
apply
show examples
and hydropower are the smallest The most common fuels in the USA are petrol and oil. They accounted for 35 in 1980 and have reached about 45 in the current year(2024) after some fluctuations. It’s predicted that their figure will have increased by 50 by 2030. Coal and natural gas stand at the second and third levels respectively. Neutral Gas despite its figure being more than coal at the commencement of the period and its increasing trend until 2015 has stayed steady and been less than coal. It will continue its steady trend till 2030. Coal which was more than 15 in 1980 and rose to the figure of natural gas in 2015, will have increased by 2030. As for renewable energy sources, nuclear, solar/wind, and hydropower have the lowest consumption. In the beginning, the amounts of their consumption had been slightly fewer than 5 in 1980 before they started to increase. Nuclear has continued its slight rise since 1985 and
reaches
Wrong verb form
will reach
show examples
more than 5 in 2024. It will have gone up with more slope by 2030. After some fluctuations from 1990 to 2005,
although
solar/wind had increased slightly before it remained steady till 2004 and will have been increasing by 2030, hydropower has stayed steadily after its slight fall in 2010.
Submitted by attarzadehosseiniaida on

Unauthorized use and/or duplication of this material without express and written permission from this site’s author and/or owner is strictly prohibited. Excerpts and links may be used, provided that full and clear credit is given to Writing9 with appropriate and specific direction to the original content.

Sentences: Add more complex sentences.
Contractions: Don't use contractions.
Common mistake: Your writing should be 150-250 words.
Vocabulary: The word "figures" was used 4 times.
Vocabulary: The word "amount" was used 2 times.
Vocabulary: The word "trend" was used 2 times.
Vocabulary: The word "increased" was used 4 times.
Vocabulary: The word "reached" was used 2 times.
Vocabulary: The word "stayed" was used 2 times.
Vocabulary: The word "fluctuations" was used 2 times.
Vocabulary: The word "slightly" was used 4 times.
Topic Vocabulary:
  • energy consumption
  • projections
  • renewable energy
  • non-renewable resources
  • sustainable
  • fossil fuels
  • nuclear energy
  • biofuels
  • hydroelectric power
  • solar energy
  • wind energy
  • trends
  • increases/decreases
  • shifts
  • milestones
  • significant
  • forecast
  • implications
  • sustainable development
What to do next:
Look at other essays: