
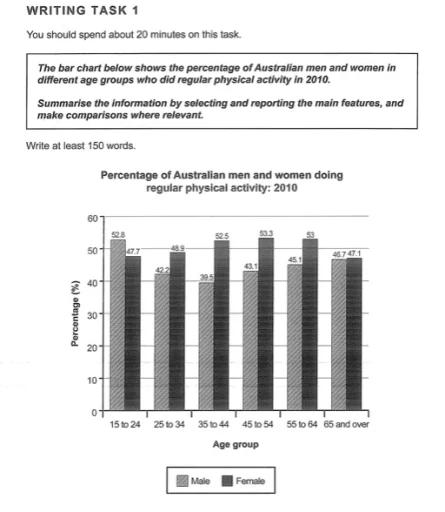
The provided bar chart shows the
percentage
of Use synonyms
Australian
Use synonyms
men
and Use synonyms
women
in different Use synonyms
age
groups who did regular physical activity in 2010.
Use synonyms
Overall
, Almost in every Linking Words
group
Use synonyms
age
, the Use synonyms
percentage
of Use synonyms
Australian
Use synonyms
women
exceeds that of Use synonyms
Australian
Use synonyms
Men
who did regular physical Use synonyms
activities
. Only in the Use synonyms
age
Use synonyms
group
of 15 to 24 Use synonyms
years
old, is the Use synonyms
percentage
of Use synonyms
Australian
Use synonyms
Men
who did the same Use synonyms
activities
more dominant than Use synonyms
Australian
Use synonyms
Women
.
With the Assumption that each of the Use synonyms
age
categories has the same Use synonyms
population
, 45 to 54-year-old Use synonyms
Australian
Use synonyms
Women
have the greatest Use synonyms
percentage
with 53.3%. Use synonyms
besides
, the lowest Linking Words
population
is the Use synonyms
age
Use synonyms
group
of 35 to 40 Use synonyms
years
old Use synonyms
Australian
Use synonyms
Men
with 39.5%.
In many productive Use synonyms
age
groups which are 25 to 34 Use synonyms
years
old, 35 to 44 Use synonyms
years
old, and 45 to 54 Use synonyms
years
old, the Use synonyms
percentage
of Use synonyms
Australian
Use synonyms
men
did less regular physical Use synonyms
activities
than the average Use synonyms
population
. the average Use synonyms
percentage
is approximately 47%, in the other hand each Use synonyms
group
only has 42.2% for the 25 to 34 Use synonyms
years
old Use synonyms
group
, 39.5% for the 35 to 44 Use synonyms
years
old Use synonyms
group
, and 43.1% for the 45 to 54 Use synonyms
years
old Use synonyms
group
.
In 2010, The bar chart Use synonyms
also
indicated the older the Linking Words
age
category of Use synonyms
Australian
Use synonyms
women
, the higher the Use synonyms
population
Use synonyms
percentage
who did regular physical Use synonyms
activities
. The term does not incorporate the oldest category, which is the category of 65 and over.
In Conclusion, Use synonyms
this
bar chart illustrates, that in 2010 Linking Words
Australian
Use synonyms
Women
did more regular physical Use synonyms
activities
in many Use synonyms
age
categories than Use synonyms
Australian
Use synonyms
men
. The other highlight point is in the productive Use synonyms
age
Use synonyms
group
, Use synonyms
Australian
Use synonyms
men
did regular physical Use synonyms
activities
below the average of all populations. It might be affected by many factors which are working hours rate, type of occupation, and people's Use synonyms
behavior
in every Change the spelling
behaviour
group
of Use synonyms
age
.Use synonyms