
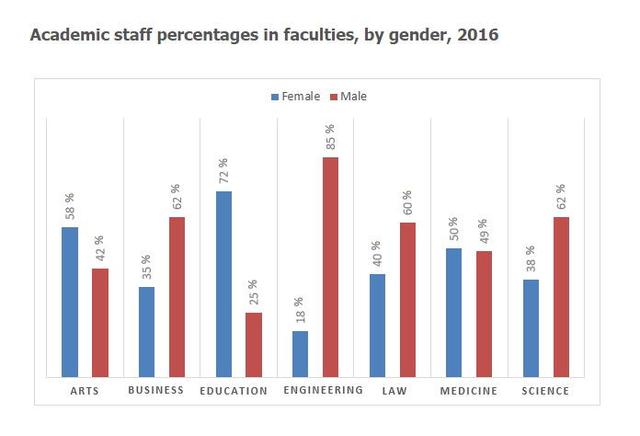
The graph illustrates the proportion of gender among faculty
members
in a university in the year 2012. Use synonyms
Overall
, engineering courses are overpowered by male Linking Words
members
Use synonyms
while
females rule education courses. Linking Words
On the other hand
, medicine has a neutral environment.
Data revealed that men dominated the engineering department with the ratio of 85 males to 15 females followed by the science and business sectors which Linking Words
similarly
have more than 60 faculty and the least exhibited in education courses where women outnumbered men by a quarter.
Pertaining to females, noticeable the highest staff Linking Words
members
were found in the education major with about 65 Use synonyms
members
followed by Art subjects with more than 50 women. Use synonyms
Whereas
, medicine has a ratio of men and women equally at approximately 45 Linking Words
members
.Use synonyms