The pie charts below show the percentage of time working adults spent on different activities in a particular country in 1958 and 2008. Summarise the information by selecting and reporting the main features and make comparisons where relevant

The pie charts below show the percentage of time working adults spent on different activities in a particular country in 1958 and 2008. 

Summarise the information by selecting and reporting the main features and make comparisons where relevant
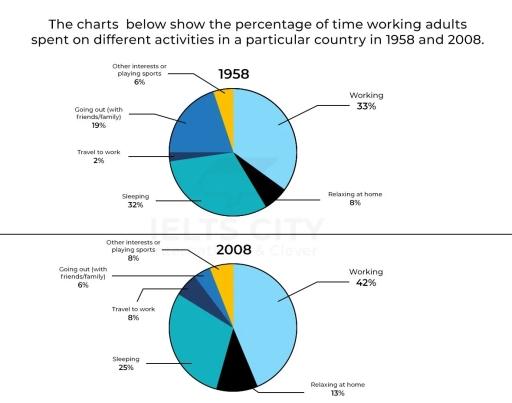
The pie charts compare the proportion of hours that people used to do activities in a country in the year 1958 and 2008.
Overall
, the activities related to work and personal interests took more time in 2008,
while
people spent fewer hours sleeping and hanging out with friends and families,
According to
the graph, working has the highest jump from 33% to 42% in 2008. Travel to work, which used to be the least portion in 1958, has the same trend with a 5% rise to 8%, same as relaxing at home from 8% to 13%.
In addition
, personal activities with hobbies and sports gained a slight increase from 6% to 8%.
On the other hand
, sleeping used to be the second highest proportion with 32%,
then
it declined to 25% in 2008. Going out
also
has a significant drop with a 13% decrease, which became the lowest percentage in 2008.
Submitted by pimpisut.sata on

Unauthorized use and/or duplication of this material without express and written permission from this site’s author and/or owner is strictly prohibited. Excerpts and links may be used, provided that full and clear credit is given to Writing9 with appropriate and specific direction to the original content.

Sentences: Add more complex sentences.
Vocabulary: The word "proportion" was used 2 times.
Vocabulary: Use several vocabularies to present the data in the second paragraph.
What to do next:
Look at other essays: