The bar chart below describes some changes about the percentage of people were born in Australia and who were born outside Australia living in urban, rural and town between 1995 and 2010. Summarise the information by selecting and reporting the main features and make comparisons where relevant. You should write at least 150 words.

The bar chart below describes some changes about the percentage of people were born in Australia and who were born outside Australia living in urban, rural and town between 1995 and 2010.

Summarise the information by selecting and reporting the main features and make comparisons where relevant.

You should write at least 150 words.
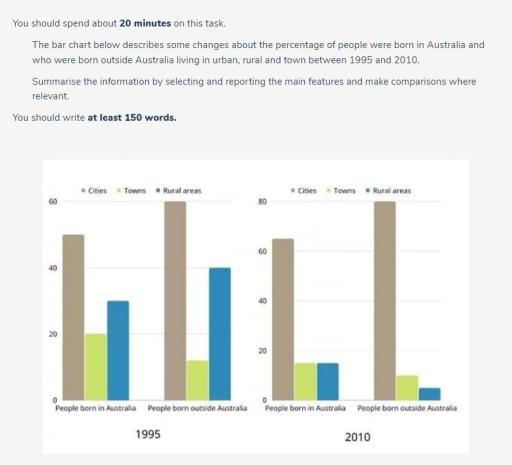
The bar chart illustrates some changes
about
Change preposition
in
show examples
the percentage of
people
born in
Australia
and
people
who were born outside
Australia
living in urban, rural and
town
Fix the agreement mistake
towns
show examples
between 1995 and 2010.
Overall
, the
statistic
Fix the agreement mistake
statistics
show examples
of
public
Add an article
the public
show examples
who
are
Wrong verb form
were
show examples
born in cities 1995 in witnessed an upward trend over a period of 15 years.
In contrast
, there was a downward trend in newborns in town between 1995 and 2010. In 1995,
people
born in
Australia
and outside
Australia
were the highest figures, accounting for 50
percent
Change the spelling
per cent
show examples
and 60
percent
Change the spelling
per cent
show examples
, respectively. Not only was the highest ratio in 1995 but
also
the percentage of who were born in cities in 2010.
In addition
,there were few developments in terms of
people
who were given birth both inside and outside
this
nation, in 2010, making up around 65
percent
Change the spelling
per cent
show examples
and 80
percent
Change the spelling
per cent
show examples
, for each. A striking feature is that the percentage of newborn babies outside
this
country reached the peak of 80
percent
Change the spelling
per cent
show examples
in 2010. There was an
overall
downward trend in figures for all levels of giving birth in other groups
such
as towns and rural areas throughout the period shown .
Submitted by buyabuya201 on

Unauthorized use and/or duplication of this material without express and written permission from this site’s author and/or owner is strictly prohibited. Excerpts and links may be used, provided that full and clear credit is given to Writing9 with appropriate and specific direction to the original content.

Linking words: Don't use the same linking words: "overall".
Vocabulary: Rephrase your introduction. Words match: 89%.
Vocabulary: Replace the words people, australia, percent with synonyms.
Vocabulary: Rephrase the word "changes" in your introduction.
Vocabulary: The word "figures" was used 2 times.
Vocabulary: The word "percentage" was used 3 times.
Vocabulary: The word "trend" was used 3 times.
Vocabulary: The word "downward" was used 2 times.
Topic Vocabulary:
  • Percentage
  • Demographic
  • Trends
  • Urban areas
  • Rural areas
  • Town
  • Native-born
  • Foreign-born
  • Migration patterns
  • Economic factors
  • Government policies
  • Increase
  • Decrease
  • Steady
  • Peak
  • Trough
  • Time frame
  • Significant changes
  • Distribution
  • Notable
What to do next:
Look at other essays: