The bar chart shows the percentage of school children learning to play different musical instrument in 2005, 2010 and 2015. (the piano was over 10% in 2005, over 20% in 2010, about 35% in 2015; the guitar was over 10% in 2005, about 18% in 2010, 40% in 2015; the drums was about 5% in 1005, about 4% in 2010, about 10% in 2015; the violin was 10% in 2005, 9% in 2010, 5% in 2015)

The bar chart shows the percentage of school children learning to play different musical instrument in 2005, 2010 and 2015. (the piano was over 10% in 2005, over 20% in 2010, about 35% in 2015; the guitar was over 10% in 2005, about 18% in 2010, 40% in 2015; the drums was about 5% in 1005, about 4% in 2010, about 10% in 2015; the violin was 10% in 2005, 9% in 2010, 5% in 2015)
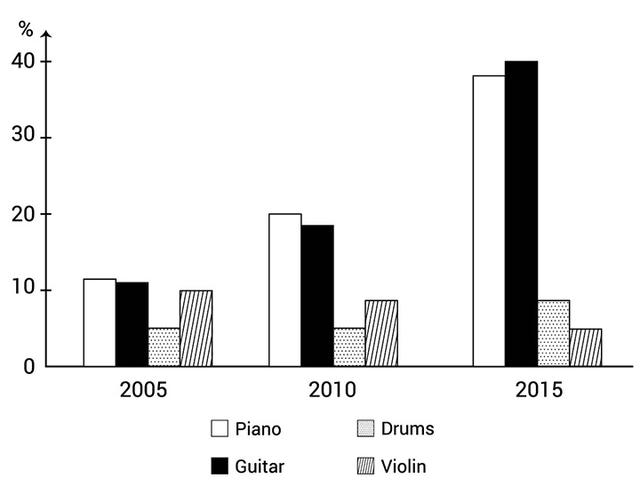
Given is a bar chart depicting the proportional representation of juveniles learning to play instruments during the period from 2005 to 2015. It is evident that most instruments became increasingly popular to learn, except for the violin. As can be seen, the piano and the guitar were the two most popular instruments; the proportions of both categories doubled every 5 years during the period in question. The number of piano players was slightly more significant than those who played the guitar in 2005 and 2010.
However
, In 2015, the guitar players surpassed the piano players for the first time and peaked at approximately 40%.
In contrast
, the number of juveniles who played drums grew gently from 5% in 2005 to roughly 10% in 2015.
On the other hand
, there was an exponential decrease in the violin. In 2005, it was the third most popular instrument for roughly 10% of juveniles learned.
Nevertheless
, the amount diminished to 5%, which was the least welcome category in 2015.
Submitted by weber61543 on

Unauthorized use and/or duplication of this material without express and written permission from this site’s author and/or owner is strictly prohibited. Excerpts and links may be used, provided that full and clear credit is given to Writing9 with appropriate and specific direction to the original content.

Introduction: The introduction is missing.
Introduction: The chart intro is missing.
Vocabulary: The word "number of" was used 2 times.
Vocabulary: The word "roughly" was used 2 times.
Topic Vocabulary:
  • Instrument proficiency
  • Year-over-year comparison
  • Percentage increase
  • Cultural impact
  • Technological advancements
  • Popularity surge
  • Music education trends
  • Instrument learning preferences
  • Gradual decline
  • Future projections
  • Statistical significance
  • Cultural preferences
  • Educational implications
  • Accessibility of instruments
  • Shifts in popular music genres
  • Adoption rates
What to do next:
Look at other essays: