The bar chart below describes some changes about the percentage of people were born in Australia and who were born outside Australia living in urban, rural and town between 1995 and 2010. Summarise the information by selecting and reporting the main features and make comparisons where relevant.

The bar chart below describes some changes about the percentage of people were born in Australia and who were born outside Australia living in urban, rural and town between 1995 and 2010.

Summarise the information by selecting and reporting the main features and make comparisons where relevant.
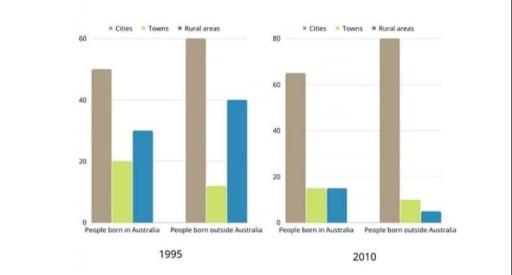
The bar charts illustrate alterations
Change preposition
in
show examples
about
Change preposition
in
show examples
the proportion of people who were born in Australia and who were born outside Australia living in urban, rural and
Fix the agreement mistake
towns
show examples
town
Fix the agreement mistake
towns
show examples
from 1995 to 2010.
Overall
, it can be seen that in non-Australian-born, the percentage of the cities did not change between 1995 and 2010.
On the contrary
, the proportion of individuals who reside in urban
areas
increased gradually. In 1995, the percentage of people who were born in Australia and lived in the cities was 50% and in 2010, it rose to 64%.
In addition
, the number of individuals who lived in the towns decreased from 20% to 15% between 1995 and 2010.
It is clear that
there was an enormous decline in the rural
areas
from 30% to 15% of Australian-born. For the non-Australian population, there is no difference in the two charts in the number of rural
areas
.
However
, the proportion of towns and rural
areas
reduced slightly from 1995 to 2010.
Submitted by buyabuya201 on

Unauthorized use and/or duplication of this material without express and written permission from this site’s author and/or owner is strictly prohibited. Excerpts and links may be used, provided that full and clear credit is given to Writing9 with appropriate and specific direction to the original content.

Vocabulary: Replace the words areas with synonyms.
Vocabulary: The word "charts" was used 2 times.
Vocabulary: The word "number of" was used 2 times.
Vocabulary: The word "percentage" was used 2 times.
Vocabulary: The word "proportion" was used 3 times.
Topic Vocabulary:
  • Percentage
  • Demographic
  • Trends
  • Urban areas
  • Rural areas
  • Town
  • Native-born
  • Foreign-born
  • Migration patterns
  • Economic factors
  • Government policies
  • Increase
  • Decrease
  • Steady
  • Peak
  • Trough
  • Time frame
  • Significant changes
  • Distribution
  • Notable
What to do next:
Look at other essays: