
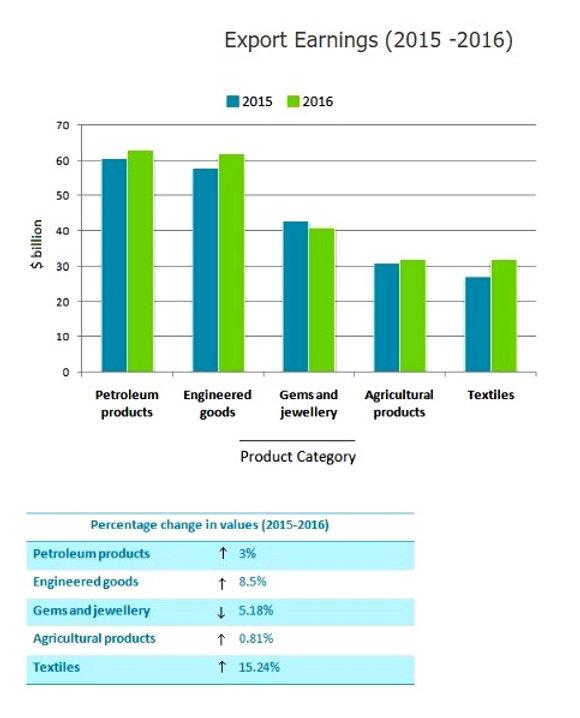
The bar chart provides statistics about how much one country’s exports cost for various categories between 2015 and 2016, with units measured in billions of dollars, and the table shows information about comparisons in values in the aforementioned two consecutive years.
Looking from an
overall
perspective, it is readily apparent that fossil fuel products and engineering goods were the most bought merchandise by foreign countries and both of them experienced a surge over the surveyed time frame.
Moving to a more detailed analysis, the figures for spending on oil and gas and engineering products witnessed a noticeable increase at 3% and 8.5% and reached the highest data respectively roughly 60 and approximately 62 in 2015 and 2016.
In terms of other exports from the country, gems and jewellery declined from 43 to exactly 40 with a significant decrease of 5%. The trend for goods used in farms remained steady at around 30 for both given years, compared to a 15% rise in expenses on fabrics from 27 to 32.Linking Words