The bar chart below shows the percentage of Australian men and women in different age groups who did regular physical activity in 2010.

The bar chart below shows the percentage of Australian men and women in different age groups who did regular physical activity in 2010.
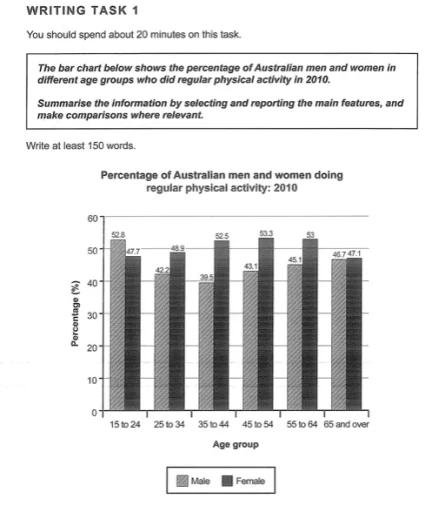
The bar chart illustrates the proportion of Australian people who did regular physical activity in various age groups by
genders
Fix the agreement mistake
gender
show examples
in 2010.
Overall
, what stands out from the graph is that females did more physical activity compared to males.
Furthermore
, men were more likely to do physical exercise between the ages of 15 and 24. Looking into detail, in 15-24,
while
the percentage of meb doing exercise was 52.8, the figure for women was just below 50%.
However
, females between 25 and 34 were more willing to sports activities than males, 48.9% and 42.2%, respectively.
Likewise
, the proportion of women between 35-44 was higher than men with 52.5% and 39.5%, respectively. In terms of older people, from 45 to
64
Add a comma
64,
show examples
the percentages of women doing physical activity were almost the same around 53% and the figures for men were approximately equal( just above a half).
Moreover
, the figures for both genders
in
Change preposition
apply
show examples
65 and over were roughly equal (just below one in two).
Submitted by Name_1234 on

Unauthorized use and/or duplication of this material without express and written permission from this site’s author and/or owner is strictly prohibited. Excerpts and links may be used, provided that full and clear credit is given to Writing9 with appropriate and specific direction to the original content.

Sentences: Add more complex sentences.
Vocabulary: The word "figure" was used 3 times.
Vocabulary: The word "percentage" was used 2 times.
Vocabulary: The word "proportion" was used 2 times.
Vocabulary: The word "just below" was used 2 times.
Topic Vocabulary:
  • Physical activity
  • Regular exercise
  • Age demographics
  • Participation rate
  • Trend analysis
  • Gender disparity
  • Health initiatives
  • Public health policies
  • Statistical comparison
  • Lifestyle choices
  • Work commitments
  • Age-related factors
  • Preventative health
  • Exercise habits
  • Surveillance data
  • Motivators and barriers
What to do next:
Look at other essays: